.svg)

Sep-2026
Sales
Trend
6-Month
Product Count
SKUs
Avg Price
YoY Sales Change
YoY Price Change


Where to Buy
Boho Euphorics is stocked at 28 licensed dispensaries across New Jersey, with the deepest coverage in Hoboken, Trenton, Absecon, Atlantic City, and Bridgeton. Search by ZIP code or city below to find the closest one, or filter by product type if you are after a specific format.
Market Insights Snapshot
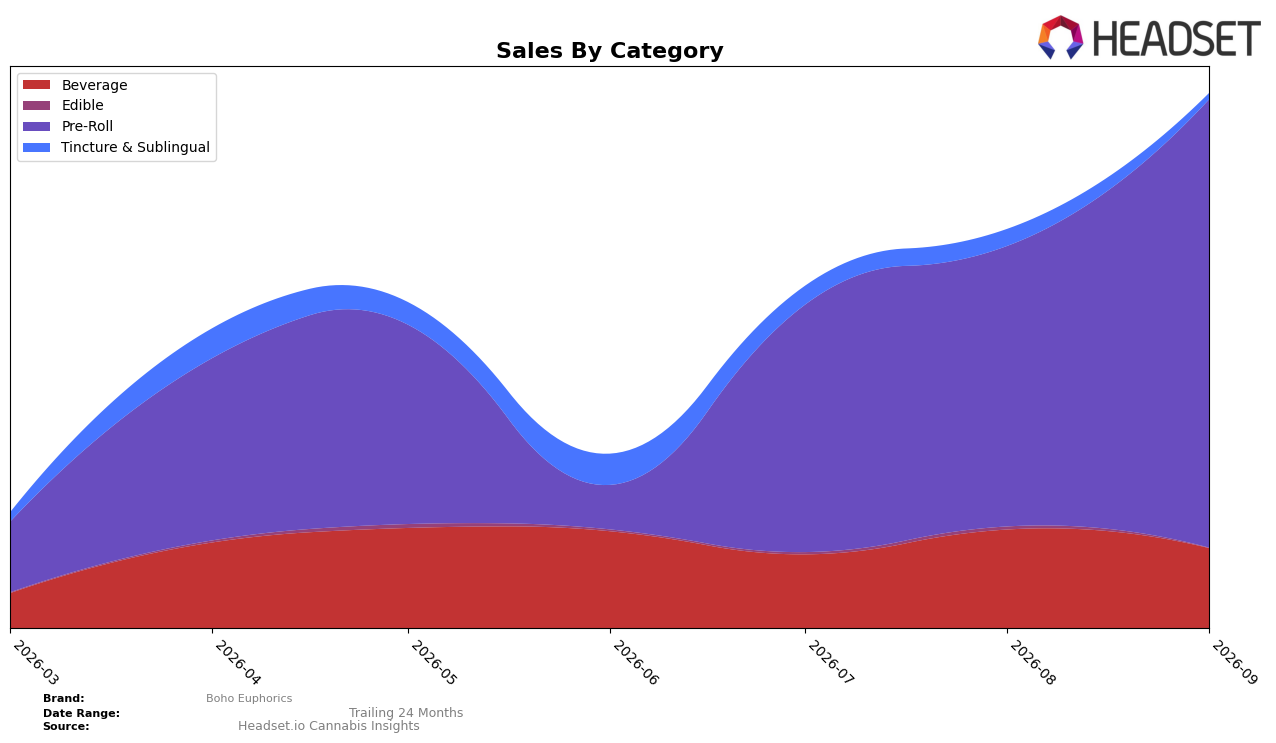
In September 2026, Boho Euphorics concentrated 83.97% of sales in Pre-Roll while Beverage held 14.91% and Tincture & Sublingual 1.12%, indicating a pronounced tilt toward inhalables. Pre-Roll expanded month over month by 60.00% as Beverage contracted by 18.98% and Tincture & Sublingual fell 64.06%, a divergence that lifts the aggregate mix toward higher-share Pre-Roll. With an average Pre-Roll price of $20.49 versus $13.22 in Beverage, the mix shift toward a 60.00% MoM gainer with higher ticket reinforces near-term revenue density, and sitting at rank 34 in New Jersey Pre-Roll implies the brand is leaning into a large-volume lane rather than diffusing across slower-moving formats.
The pivot toward Pre-Roll (up 60.00% MoM) alongside simultaneous pullbacks in Beverage (down 18.98% MoM) and Tincture & Sublingual (down 64.06% MoM) signals a deliberate allocation toward faster-turn inventory and price points that support trade-up from the $13.22 Beverage tier to the $20.49 Pre-Roll tier. Given a 83.97% share concentration in Pre-Roll while holding rank 34 in New Jersey for that category, the brand’s positioning favors scale within a competitive mid-pack rather than breadth across niche formats, implying that future gains will depend more on depth in Pre-Roll assortment and velocity management than on diversification.
Competitive Landscape
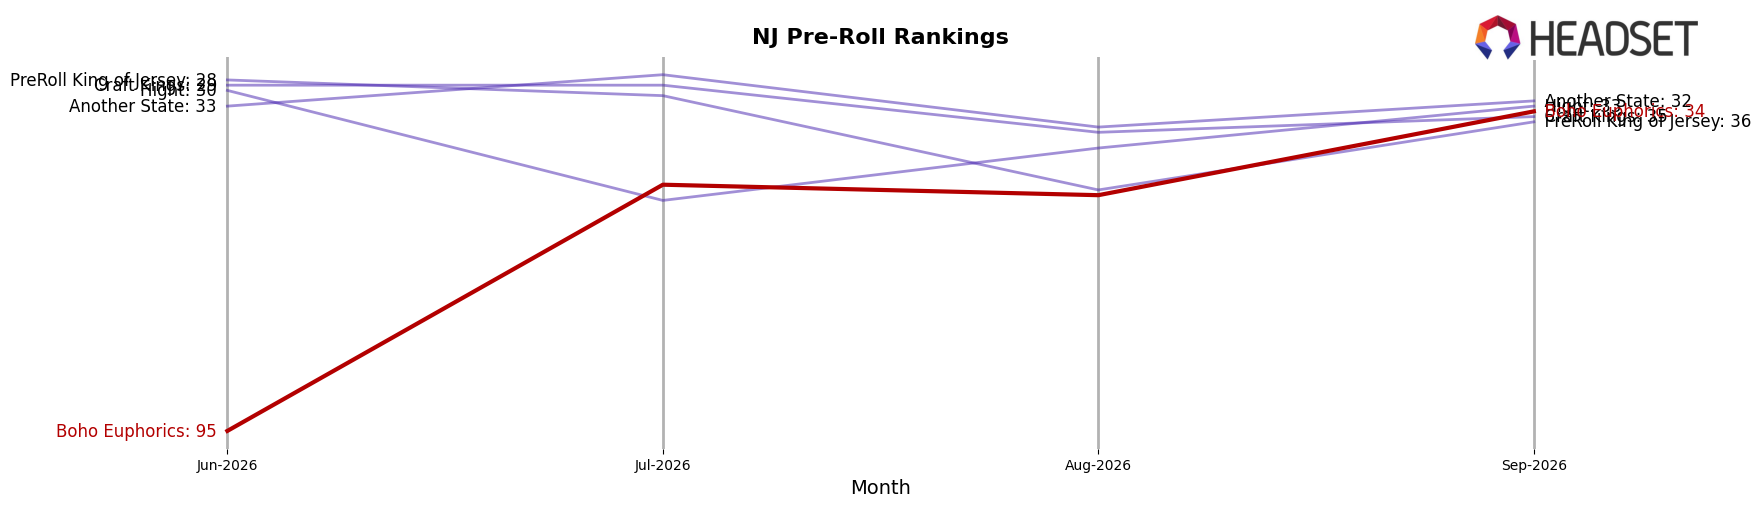
Boho Euphorics sits at rank 34 in NJ Pre-Roll, with no year-over-year rank available but a sharp climb from rank 95 in June 2026 to rank 34 in September 2026, marking a 61-position improvement and a new peak at rank 34 in September 2026. Against the leaders, RYTHM holds rank 1 with a year-over-year sales change of 50.73% while Ozone is at rank 2 with an 81.08% year-over-year sales change, indicating Boho Euphorics’ mid-table ascent outpaced its own three-month baseline but still trails top-tier velocity; meanwhile, Lowell Herb Co / Lowell Smokes sits at rank 3 with a -34.38% year-over-year sales change, suggesting space has opened among early leaders even as Dogwalkers advances to rank 5 with an 8-rank year-over-year improvement and 15.30% sales growth. The pattern implies a momentum-driven repositioning: rapid rank gain over three months enables Boho Euphorics to capitalize on declines among some top-5 incumbents while still needing additional share capture to close the gap to ranks 1–2.
Notable Products
Strawberry Infused Pre-Roll (1g) posted the largest month-over-month surge at 111.7% and climbed to rank 4, while Lemon Infused Pre-Roll (1g) fell 20.6% to rank 9, indicating flavor-size bifurcation within the same format. The top three positions were captured by Strawberry, Blueberry, and Grape Infused Pre-Roll 5-Packs with gains of 91.1%, 72.7%, and 61.8% respectively, and four of the top ten are Pre-Roll 5-Packs, pointing to multipack-led velocity that is outpacing single sticks.
Blueberry Infused Pre-Roll (1g) rose 43.9% at rank 5 while Grape Infused Pre-Roll (1g) advanced 78.6% at rank 6, but Beverage entries diverged with Blue Raspberry Syrup Shot dropping 29.0% at rank 10 as Peach Iced Tea entered at rank 8 with $3,355 in September 2026. The pattern suggests Boho Euphorics is concentrating demand in flavored infused Pre-Roll families—especially multipacks—while beverages remain fragmented and vulnerable to volatility.
Top Selling Cannabis Brands






Data for this report comes from real-time sales reporting by participating cannabis retailers via their point-of-sale systems, which are linked up with Headset’s business intelligence software. Headset’s data is very reliable, as it comes digitally direct from our partner retailers. However, the potential does exist for misreporting in the instance of duplicates, incorrectly classified products, inaccurate entry of products into point-of-sale systems, or even simple human error at the point of purchase. Thus, there is a slight margin of error to consider. Brands listed on this page are ranked in the top twenty within the market and product category by total retail sales volume.

