.svg)

Aug-2026
Sales
Trend
6-Month
Product Count
SKUs
Avg Price
YoY Sales Change
YoY Price Change


Where to Buy
City Roots is stocked at 11 licensed dispensaries across California, with the deepest coverage in San Diego, La Mesa, Chula Vista, Encinitas, and Lemon Grove. Search by ZIP code or city below to find the closest one, or filter by product type if you are after a specific format.
Market Insights Snapshot
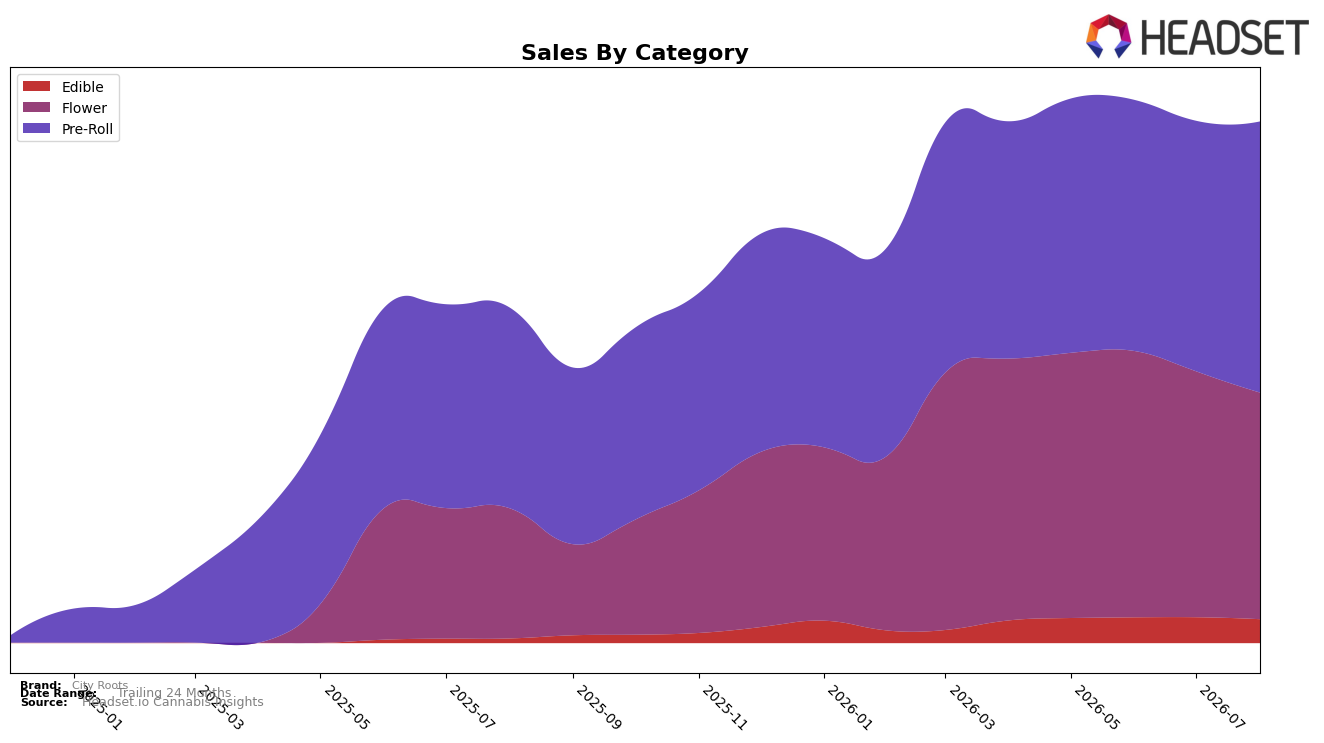
City Roots concentrated 52.00% of August 2026 sales in Pre-Roll, where year-over-year growth was 35.12% and month-over-month growth was 8.23%, while Flower held 43.45% share with a 74.17% year-over-year increase but a 7.85% month-over-month decline. Edible contributed 4.55% share with a 432.77% year-over-year surge yet slipped 7.65% month-over-month. The category split points to a portfolio leaning on two core inhalables that are diverging in momentum between months, implying that August 2026 growth was supported by Pre-Roll stability even as Flower retrenched within the month.
Average price edged up 0.77% year over year to $15.27 as mix tilted toward Pre-Roll with an average price of $12.70 and away from higher-priced Flower month over month, while August 2026 rank in California Pre-Roll sat at 26. With Pre-Roll up 8.23% month over month and Flower down 7.85% month over month, City Roots is positioned as a value-forward inhalables player whose near-term shelf traction depends on Pre-Roll depth, suggesting that sustaining share gains will require reinforcing Pre-Roll visibility while managing Flower volatility to prevent a drift from rank 26 in California.
Competitive Landscape
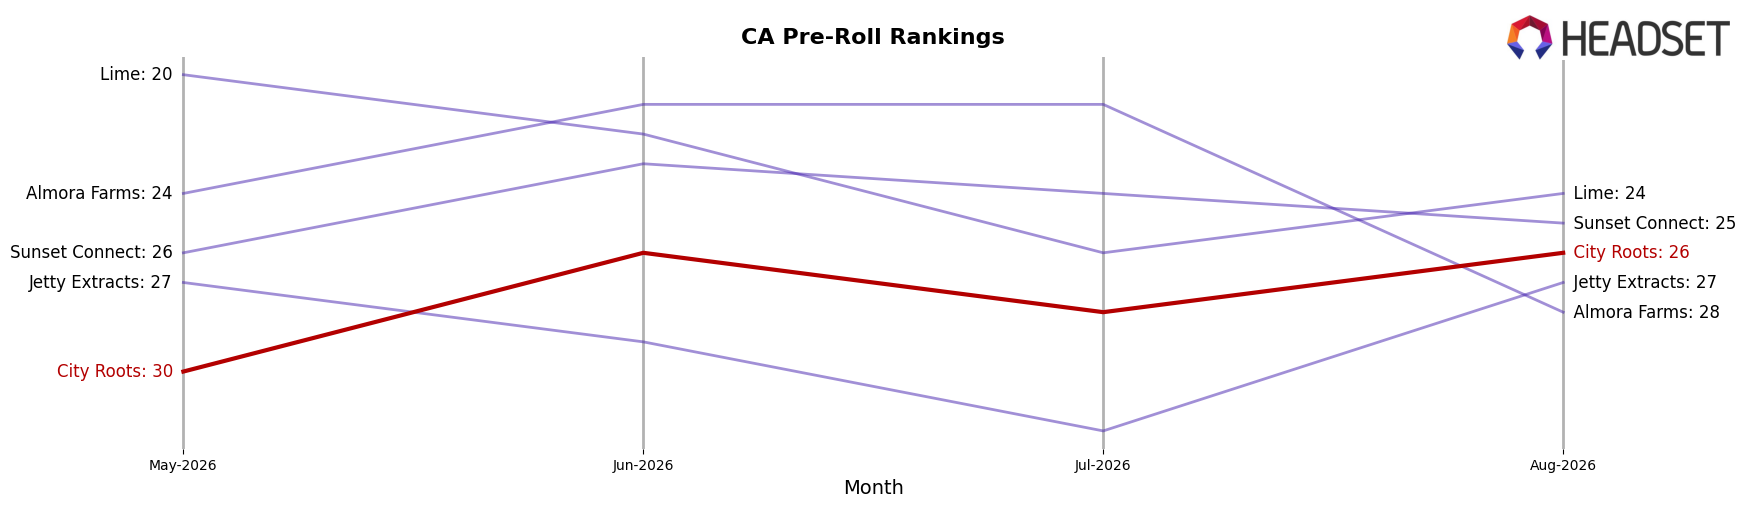
City Roots ranks #26 in CA Pre-Roll in August 2026, improving 3 positions year over year from #29 and rising 4 spots since May 2026 from #30 to #26; this also marks a new peak rank of #26 in August 2026 while holding outside the top 25. In contrast, Jeeter held at #1 year over year with sales up 5.7%, and Presidential moved up from #5 to #4 with an 8.9% YoY sales lift, while Sluggers Hit slipped from #4 to #5 with sales down 0.4%; relative to these shifts, City Roots’ climb from #29 to #26 narrows the gap to mid-tier incumbents but still trails the stable top two led by STIIIZY at #2 with a 10.4% YoY sales increase. The rank trajectory implies City Roots is converting incremental gains into share stability at the edge of the top 25, positioning the brand for potential threshold-crossing if monthly rank volatility among #20–#25 persists.
Notable Products
Mango Poison Infused Pre-Roll 2-Pack (2.4g) posted the month’s breakout with a +406% MoM surge to rank 2, while category leader Watermelon Kush Infused Pre-Roll 2-Pack (2.4g) fell 41% MoM yet held rank 1. Strawberry Cough Pre-Roll (1g) slipped 9% MoM at rank 5, and Banana Cream OG Infused Pre-Roll 2-Pack (2.4g) declined 9% MoM at rank 7, indicating mixed momentum inside the same format. With seven of the top ten SKUs in Pre-Roll, the portfolio is concentrating around infused and classic singles, implying City Roots is leaning into high-velocity inhalables while allowing volatility at the top to act as the entry point for rapid-share experiments.
Skywalker OG Pre-Roll (1g) inched up 5% MoM to rank 4, contrasting the 4% MoM dip for Pink Acai Infused Pre-Roll 2-Pack (2.4g) at rank 3 and the 4% MoM decline for Wedding Cake Pre-Roll (1g) at rank 6. Outside Pre-Roll, the Flower entry Key Holder (7g) reached rank 9 on $48,250 with no MoM baseline, while the Edible CBN/THC 1:2 Sour Berry Zen Gummy (50mg CBN, 100mg THC) debuted at rank 8 with no MoM, suggesting City Roots is testing adjacent formats to stabilize revenue against Pre-Roll swings.
Top Selling Cannabis Brands






Data for this report comes from real-time sales reporting by participating cannabis retailers via their point-of-sale systems, which are linked up with Headset’s business intelligence software. Headset’s data is very reliable, as it comes digitally direct from our partner retailers. However, the potential does exist for misreporting in the instance of duplicates, incorrectly classified products, inaccurate entry of products into point-of-sale systems, or even simple human error at the point of purchase. Thus, there is a slight margin of error to consider. Brands listed on this page are ranked in the top twenty within the market and product category by total retail sales volume.

