May-2026
Sales
Trend
6-Month
Product Count
SKUs
Avg Price
YoY Sales Change
YoY Price Change
Market Insights Snapshot
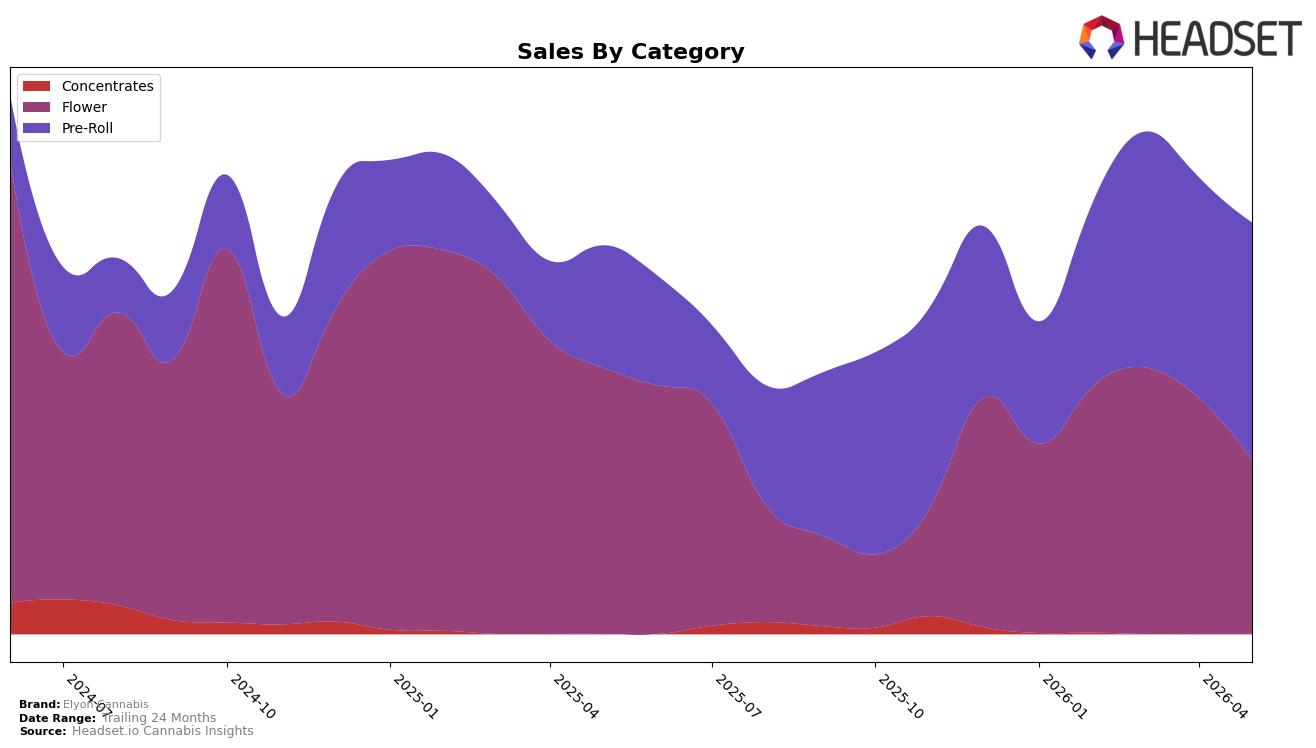
In May 2026, Elyon Cannabis concentrated 57.87% of sales in Pre-Roll with 42.13% in Flower, a mix that shifted YoY as Pre-Roll sales climbed 94.48% while Flower declined 34.83%, and shifted MoM with Pre-Roll up 7.93% versus Flower down 26.63%. The brand’s overall average price fell 37.66% YoY to $12.25, aligning with a Pre-Roll average price of 8.55 and a relatively premium Flower average price of 30.12, indicating volume migration into lower-priced units. The pattern implies Elyon Cannabis is pivoting toward Pre-Roll scale at lower price points while de-emphasizing higher-ticket Flower, trading margin for share within an accessible value tier.
With Pre-Roll now the top category at a 57.87% share and a category rank of 19 in New Jersey Pre-Roll, Elyon Cannabis is positioned as a mid-pack option competing on price and availability rather than premium differentiation. The 7.93% MoM lift in Pre-Roll alongside a 26.63% MoM decline in Flower suggests near-term shelf strategy is amplifying velocity on value-focused items while conceding presence in premium-priced formats; combined with a 5.92% YoY brand sales gain against a 38.09% two-year decline, the thesis is that Elyon Cannabis is stabilizing through a value-led Pre-Roll core that may cap premium equity but can recover unit throughput.
Competitive Landscape
Elyon Cannabis ranks #19 in NJ Pre-Roll in May 2026, improving 12 positions from #31 year over year, while holding flat versus February 2026 at #19; this peak position in May 2026 coincides with competitors reshuffling, as RYTHM sits at #1 after moving up from #3 and Ozone rose from #10 to #2 with 131.6% sales growth year over year, compared with Elyon Cannabis advancing 12 ranks amid a top tier where Garden Greens slipped from #1 to #3 alongside a 41.2% sales decline; the implication is that Elyon Cannabis’s climb from #31 to #19 amid leaders’ mixed momentum sets a path for further share capture if it converts stability at #19 into incremental rank gains against brands that are either contracting at the top or accelerating from mid-pack.

Notable Products
Key Biscayne Pre-Roll (1.25g) posted the standout move in May 2026 with a +60.6% month-over-month surge to rank 1, while LA Kush Cake Pre-Roll (1.25g) fell -55.1% to rank 9. Cadillac Rainbow Pre-Roll (1.25g) dropped -25.6% at rank 3, contrasting with Nerdz on Fire Pre-Roll (1.25g) up +18.9% at rank 6. With all top 10 products in the Pre-Roll category and one SKU capturing $32,142, the mix implies Elyon Cannabis is consolidating around a single flagship while tolerating high volatility in the long tail.
Top Selling Cannabis Brands
Data for this report comes from real-time sales reporting by participating cannabis retailers via their point-of-sale systems, which are linked up with Headset’s business intelligence software. Headset’s data is very reliable, as it comes digitally direct from our partner retailers. However, the potential does exist for misreporting in the instance of duplicates, incorrectly classified products, inaccurate entry of products into point-of-sale systems, or even simple human error at the point of purchase. Thus, there is a slight margin of error to consider. Brands listed on this page are ranked in the top twenty within the market and product category by total retail sales volume.

