May-2026
Sales
Trend
6-Month
Product Count
SKUs
Avg Price
YoY Sales Change
YoY Price Change
Market Insights Snapshot
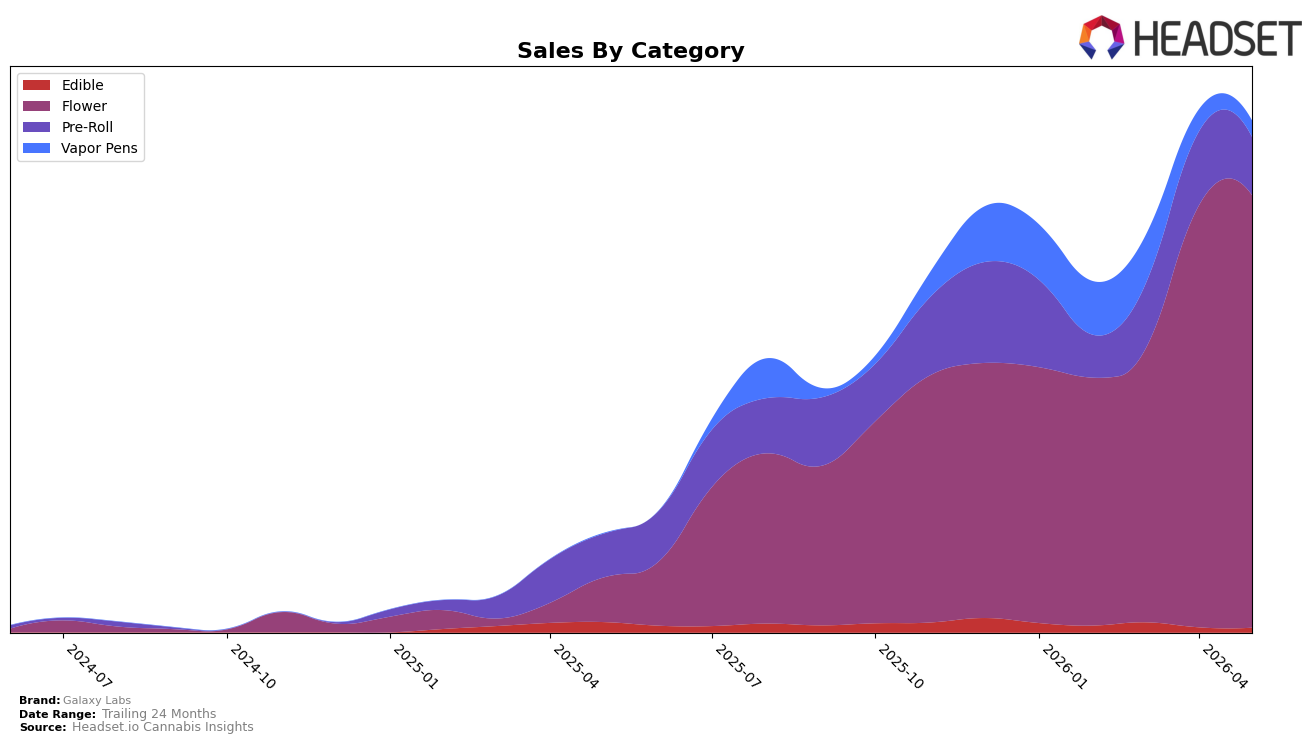
Galaxy Labs in May 2026 concentrated 84.59% of sales in Flower, up 2.62% month over month and 878.93% year over year, while Pre-Roll held 11.33% share with a 21.36% MoM decline but a 33.31% YoY increase. Vapor Pens represented 3.16% share with a 26.31% MoM contraction alongside a 3,941.21% YoY spike, and Edible slipped to 0.92% share with a 7.66% MoM and 54.51% YoY decline; the average brand price rose 9.49% YoY to $44.39. With Flower ranked 26th in Illinois, the mix signals heavy reliance on a single category for scale while smaller lines either taper month to month or remain too thin to offset volatility, implying concentration risk even amid headline growth.
The combination of an 878.93% YoY surge in Flower and simultaneous MoM pullbacks of 21.36% in Pre-Roll and 26.31% in Vapor Pens points to a portfolio that wins on core inhalables but lacks breadth to stabilize monthly comps; the 3,941.21% YoY Vapor Pens jump from a low base has not translated into May 2026 momentum. Given Flower’s 84.59% share and a 2.62% MoM uptick, alongside Edible’s 54.51% YoY contraction and sub‑1% share, the brand’s positioning skews toward potency-driven formats rather than basket-building variety, which implies that advancing from rank 26 in Illinois will depend on converting YoY interest in Vapor Pens into sustained MoM gains while arresting the Pre-Roll slide.
Competitive Landscape
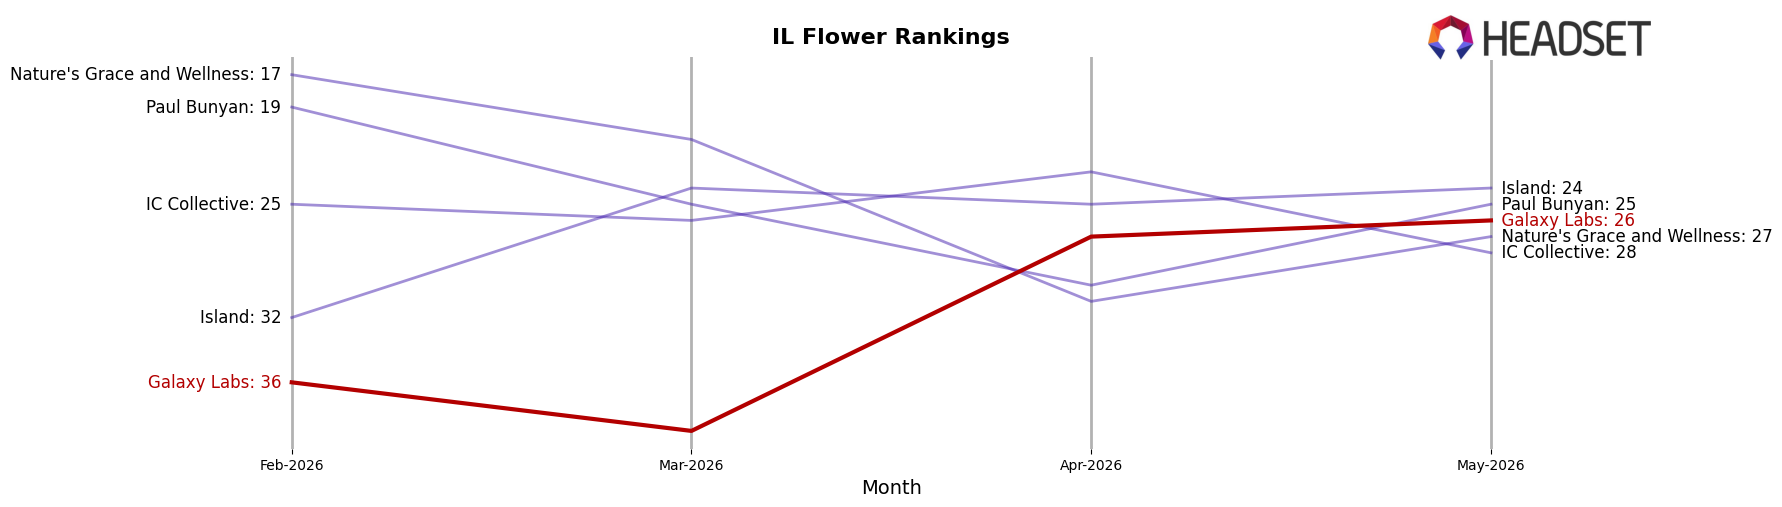
Galaxy Labs is ranked #26 in IL Flower in May 2026, rising 36 positions from #62 year over year, and improving 10 spots from #36 three months ago; this new peak rank of #26 in May 2026 places the brand closer to the top quartile while still 25 places behind High Supply / Supply at #1, a leader that held #1 year over year with 29.8% sales growth as RYTHM sits at #2 with a 12.2% sales decline. Compared with Good Green climbing from #6 to #3 (a 3-rank gain) and &Shine moving from #7 to #4 (a 3-rank gain), Galaxy Labs’ 36-rank YoY jump paired with a 10-rank gain since February 2026 signals momentum driven by redistribution within the top five and widening performance dispersion, implying a window to convert mid-tier share while top players either consolidate (#1) or contract (#2).
Notable Products
Scotch and Soda (3.5g) posted the steepest movement in May 2026 with a -16.4% month-over-month decline, slipping to rank 5, while Subzero 12 (14g) plunged -47.7% to rank 7, signaling demand rotation away from mid-size packs; by contrast, Sherb Cocktail #7 (28g) rose +12.7% to rank 3, indicating that momentum is consolidating in larger 28g formats. Garlic Cocktail #7 (28g) held rank 1 with $58,623 in sales and Subzero 12 (28g) stayed at rank 2 with a +4.6% lift, and with eight of the top ten SKUs in Flower and three of the top four in 28g, the portfolio is tilting toward high-volume ounce buyers over smaller pack trial. The concurrence of a -47.7% drop in a 14g variant alongside a +12.7% gain in a 28g alternative implies that Galaxy Labs is concentrating velocity in fewer, larger-size leaders, trading up rather than broadening pack-size dispersion.
Top Selling Cannabis Brands
Data for this report comes from real-time sales reporting by participating cannabis retailers via their point-of-sale systems, which are linked up with Headset’s business intelligence software. Headset’s data is very reliable, as it comes digitally direct from our partner retailers. However, the potential does exist for misreporting in the instance of duplicates, incorrectly classified products, inaccurate entry of products into point-of-sale systems, or even simple human error at the point of purchase. Thus, there is a slight margin of error to consider. Brands listed on this page are ranked in the top twenty within the market and product category by total retail sales volume.

