

Sep-2026
Sales
Trend
6-Month
Product Count
SKUs
Avg Price
YoY Sales Change
YoY Price Change


Market Insights Snapshot
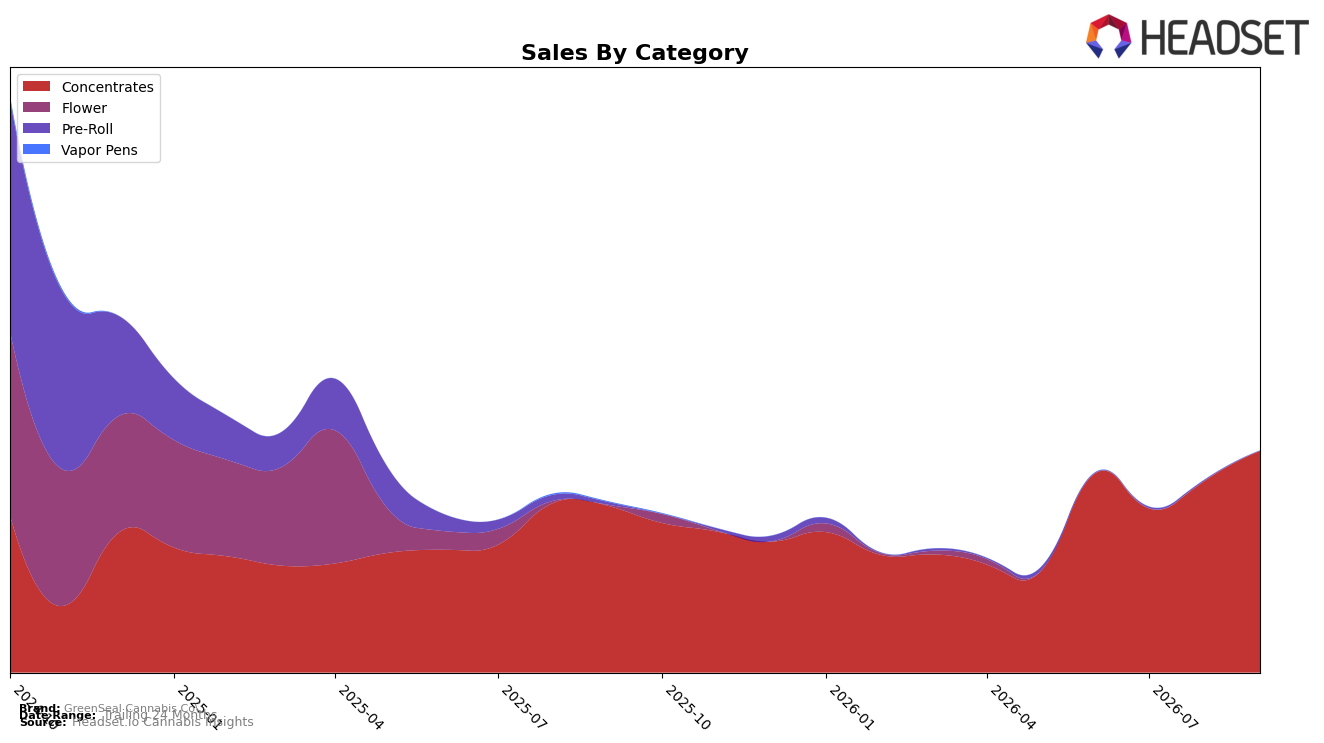
In September 2026, GreenSeal Cannabis Co. operated as a single-category brand with Concentrates accounting for 100.0% of sales, rising 32.95% year over year and 15.60% month over month, while the brand’s overall sales advanced 29.87% YoY and average price increased 3.91% YoY to $24.02. Within Ontario Concentrates, the brand held rank 30, indicating mid-pack placement despite a double-digit MoM gain and a higher YoY growth rate than the total brand figure; the pattern implies that category concentration is driving short-term momentum but constraining diversification-led resilience.
The consolidation into Concentrates at 100.0% share, paired with a 15.60% MoM lift and rank 30 in Ontario, suggests positioning as a price-stable specialist rather than a multi-category hedge, given only a 3.91% YoY price uptick against double-digit volume-led growth. With 24-month sales down 67.96% despite September 2026 YoY growth of 29.87%, the brand’s mid-tier rank and single-category reliance imply vulnerability to category volatility and limited cross-category capture, meaning the current gains are likely sensitivity to Concentrates-specific tailwinds rather than portfolio breadth.
Competitive Landscape
GreenSeal Cannabis Co. sits at rank #30 in ON Concentrates in September 2026, improving 9 positions from #39 year over year, while edging up 3 spots from #33 in June 2026 to reach a peak rank of #30 in September 2026; by contrast, Pura Vida advanced from #4 to #2 year over year and BoxHot moved from #9 to #5 alongside a 52.3% YoY sales lift, whereas Nugz (Canada) slipped from #2 to #3 with a 30.8% YoY sales decline and Endgame fell from #3 to #4 with a 37.9% YoY drop; against this mixed top-tier reshuffle and a flat #1 for Vortex Cannabis Inc., GreenSeal Cannabis Co.’s move from #39 to #30 and quarter-over-quarter rise from #33 to #30 implies a gradual climb into the competitive mid-pack where incremental share gains are achievable if momentum is sustained.

Notable Products
Hybrid Live Hash (2g) led September 2026 with a 15.6% month-over-month increase and held rank 1, while the absence of any ranked Pre-Roll SKUs indicates a category pullback greater than 10% in relative share of attention versus Concentrates. With one Concentrates SKU at rank 1 and three unranked Pre-Roll items, the portfolio is concentrated in a single performing SKU rather than a balanced top-10 footprint. The $48,310 result for Hybrid Live Hash (2g) alongside unranked Pre-Rolls implies GreenSeal Cannabis Co. is leaning into Concentrates leadership while deprioritizing or missing traction in Pre-Rolls, pointing to a strategic tilt toward potency-driven formats over multi-pack Pre-Rolls.
Top Selling Cannabis Brands



Data for this report comes from real-time sales reporting by participating cannabis retailers via their point-of-sale systems, which are linked up with Headset’s business intelligence software. Headset’s data is very reliable, as it comes digitally direct from our partner retailers. However, the potential does exist for misreporting in the instance of duplicates, incorrectly classified products, inaccurate entry of products into point-of-sale systems, or even simple human error at the point of purchase. Thus, there is a slight margin of error to consider. Brands listed on this page are ranked in the top twenty within the market and product category by total retail sales volume.

