Market Insights Snapshot
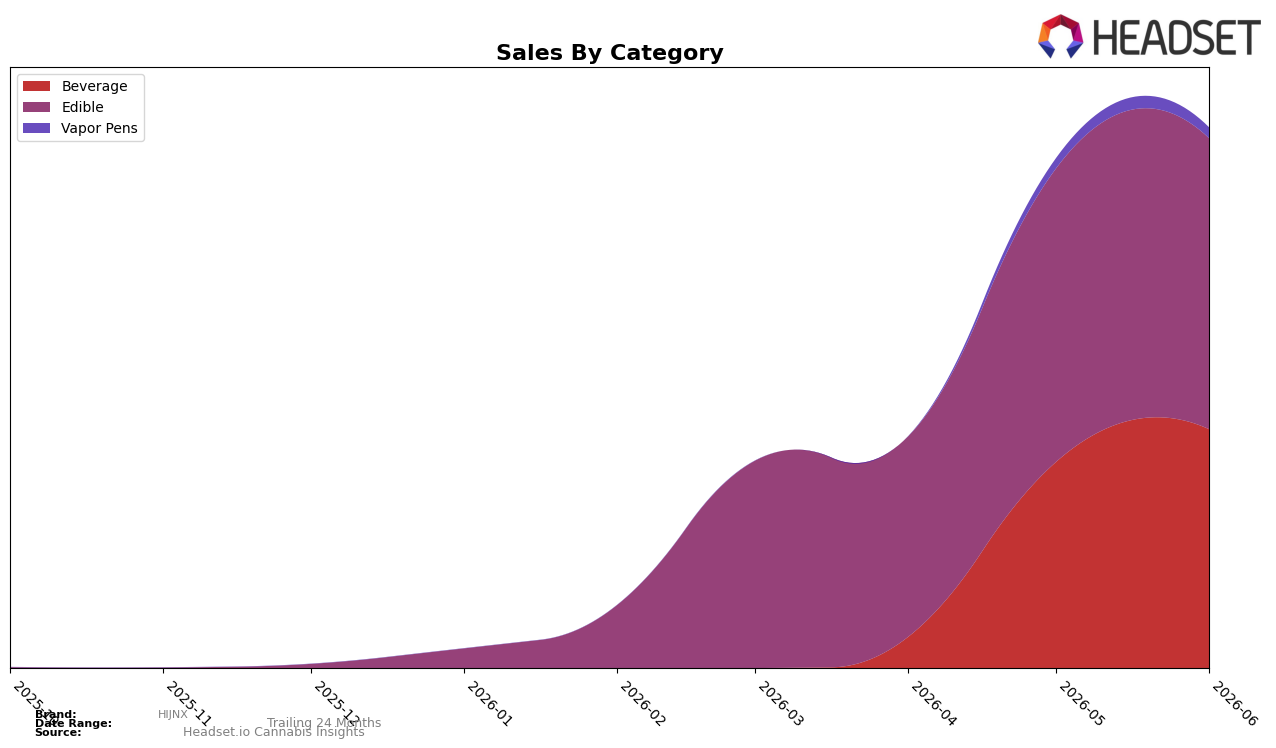
HIJNX concentrated 53.81% of June 2026 sales in Edible while Beverage accounted for 44.22% and Vapor Pens 1.97%, a mix that tilted toward Beverage as its month-over-month change was +15.67% versus Edible at -0.95% and Vapor Pens at +5.00%. Average price diverged by category, with Beverage at $12.24 versus Edible at $8.64, implying the +15.67% Beverage lift carried more revenue per unit than the -0.95% Edible drag, while Vapor Pens’ $47.59 ticket did little to shift share at just 1.97%. In Illinois Edible rank sat at 42, which, paired with a -0.95% Edible trend and a 53.81% reliance on the segment, implies that June 2026 performance leaned on a lower-ranked core while the higher-priced Beverage push provided incremental buoyancy.
The mix shift toward Beverage (+15.67% MoM against a 44.22% share) alongside a -0.95% MoM Edible change at 53.81% share implies HIJNX is trading into higher average price points without overexposing to a low-penetration format, given Vapor Pens hold only 1.97% share despite a +5.00% MoM. With Edible ranked 42 in Illinois, the brand’s dependence on that category suggests headroom comes from sustaining Beverage momentum and selectively scaling Vapor Pens, because a 44.22% Beverage base growing at +15.67% can compound faster than a majority stake in a -0.95% category.
Competitive Landscape
HIJNX is ranked #42 in Illinois Edible for June 2026, improving 4 positions from #46 in March 2026, and setting a peak rank of #42 in June 2026; in contrast, Incredibles sits at #1 while slipping 1 position year over year and Wyld holds #2 after a 1-position rise year over year with a 17.5% sales decline, whereas Gron / Grön climbed to #4 with an 18-position YoY surge alongside 193.7% sales growth. With HIJNX moving from #46 to #42 in three months amid top-tier churn—where Wana remains #3 despite a 10.8% YoY sales drop and Savvy is #5 after a 1-rank YoY improvement—this trajectory implies HIJNX is edging into mid-pack consideration, benefiting from gaps opened by incumbents’ negative YoY sales while needing sustained share gains to convert a short-term rank lift into durable placement.

Notable Products
CBD/THC 1:1 Space Chunk Gummy (50mg CBD, 50mg THC) posted the largest move in June 2026 with a 681.9% month-over-month surge into rank 7, while Space Chunk OG RSO Gummy (50mg) jumped 396.9% to rank 8, signaling rapid traction for lower-dose and ratio formats within the Space Chunk family. At the top, Space Chunk - OG Rex RSO Gummies 2-Pack (100mg) fell 32.6% yet held rank 1 with $25,010, as OG Space Chunk Zuul RSO Gummy 2-Pack (100mg) rose 41.4% at rank 2 and Blue Razz RSO Shooter (100mg THC, 2oz, 59ml) climbed 43.0% to rank 3, indicating mix-shift pressure from value and flavor-led entries. With six of the top ten as Edible SKUs, the portfolio tilts toward gummies even as Beverage Shooters at ranks 3–5 grew between 0.1% and 43.0%, implying a barbell strategy where classic high-dose anchors coexist with fast-ramping micro/ratio line extensions.
Top Selling Cannabis Brands
Data for this report comes from real-time sales reporting by participating cannabis retailers via their point-of-sale systems, which are linked up with Headset’s business intelligence software. Headset’s data is very reliable, as it comes digitally direct from our partner retailers. However, the potential does exist for misreporting in the instance of duplicates, incorrectly classified products, inaccurate entry of products into point-of-sale systems, or even simple human error at the point of purchase. Thus, there is a slight margin of error to consider. Brands listed on this page are ranked in the top twenty within the market and product category by total retail sales volume.

