

Sep-2026
Sales
Trend
6-Month
Product Count
SKUs
Avg Price
YoY Sales Change
YoY Price Change


Is this your brand?
See your full sales and distribution data: where you sell, how you're priced, and how you rank against the brands next to you on the shelf.
See your brand's dataCarry this brand in your store?
Headset Retailer is free. Connect your POS and see what's selling and what's sitting.
Sign up freeWhere to Buy
Jerzy Landscapes is stocked at 51 licensed dispensaries across New Jersey, with the deepest coverage in Atlantic City, Jersey City, Hoboken, Mount Laurel, and New Brunswick. Search by ZIP code or city below to find the closest one, or filter by product type if you are after a specific format.
Market Insights Snapshot
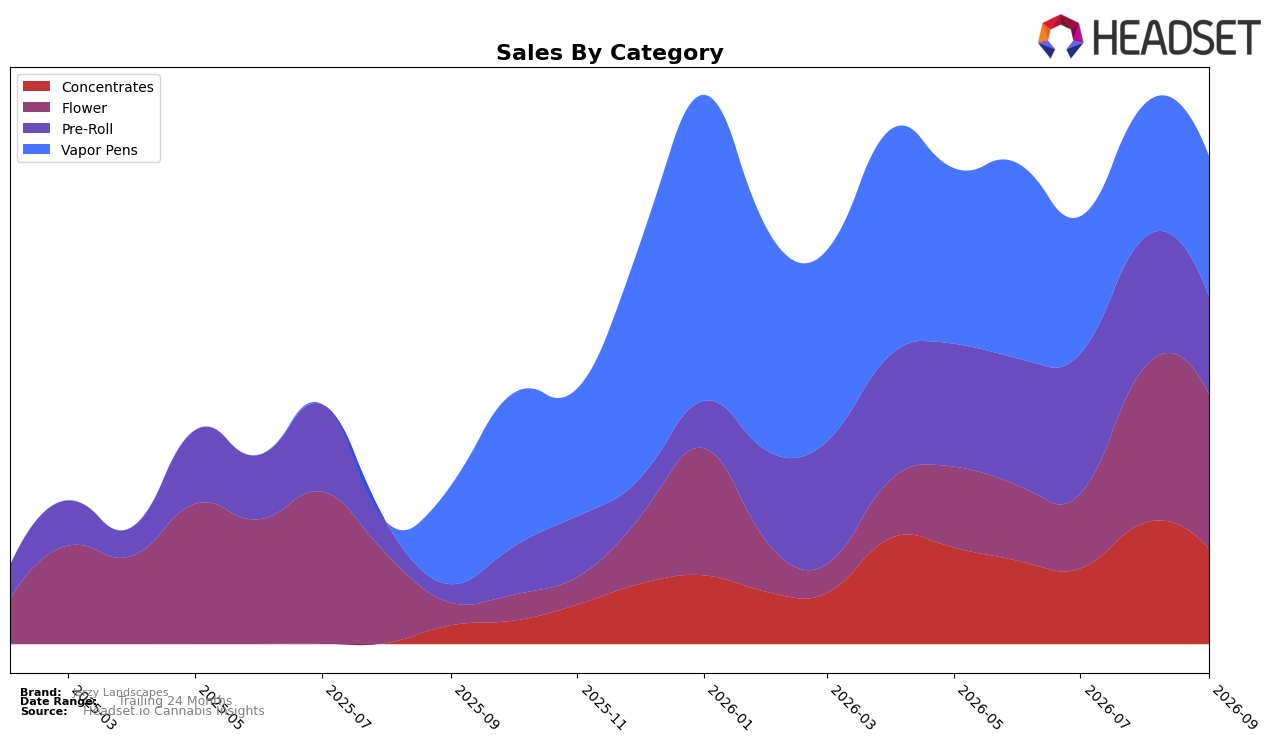
Jerzy Landscapes concentrated 31.73% of September 2026 sales in Flower, ranking 87th in New Jersey, while Vapor Pens held 28.87% and Pre-Roll and Concentrates split 19.94% and 19.47% respectively; this mix sits alongside a 589.93% year-over-year surge in Flower with a -0.84% month-over-month dip, and a 43.17% year-over-year rise in Vapor Pens with a 5.31% month-over-month gain. Pre-Roll and Concentrates each posted large year-over-year expansions at 432.02% and 409.05%, contrasted by sharp month-over-month declines of -24.99% and -21.88%, and the brand’s average price fell -11.38% year over year as overall sales rose 209.29% year over year; taken together, this points to rapid scale-up driven by lower pricing and heavier mix in Flower and Vapor Pens despite intra-month volatility in value-oriented formats.
The combination of a top-category Flower share at 31.73% and a state-category rank of 87 in New Jersey, paired with Vapor Pens’ 28.87% share and positive 5.31% month-over-month momentum, implies positioning anchored in mainstream inhalables rather than niche extracts or pre-roll multipacks. With Pre-Roll and Concentrates delivering 432.02% and 409.05% year-over-year growth but retreating -24.99% and -21.88% month over month, and the brand’s average price contracting -11.38% year over year against a 209.29% sales increase, the pattern suggests Jerzy Landscapes is trading price for velocity to build distribution, prioritizing repeatable turns in Flower and Vapor Pens while de-emphasizing near-term depth in more volatile value formats.
Competitive Landscape
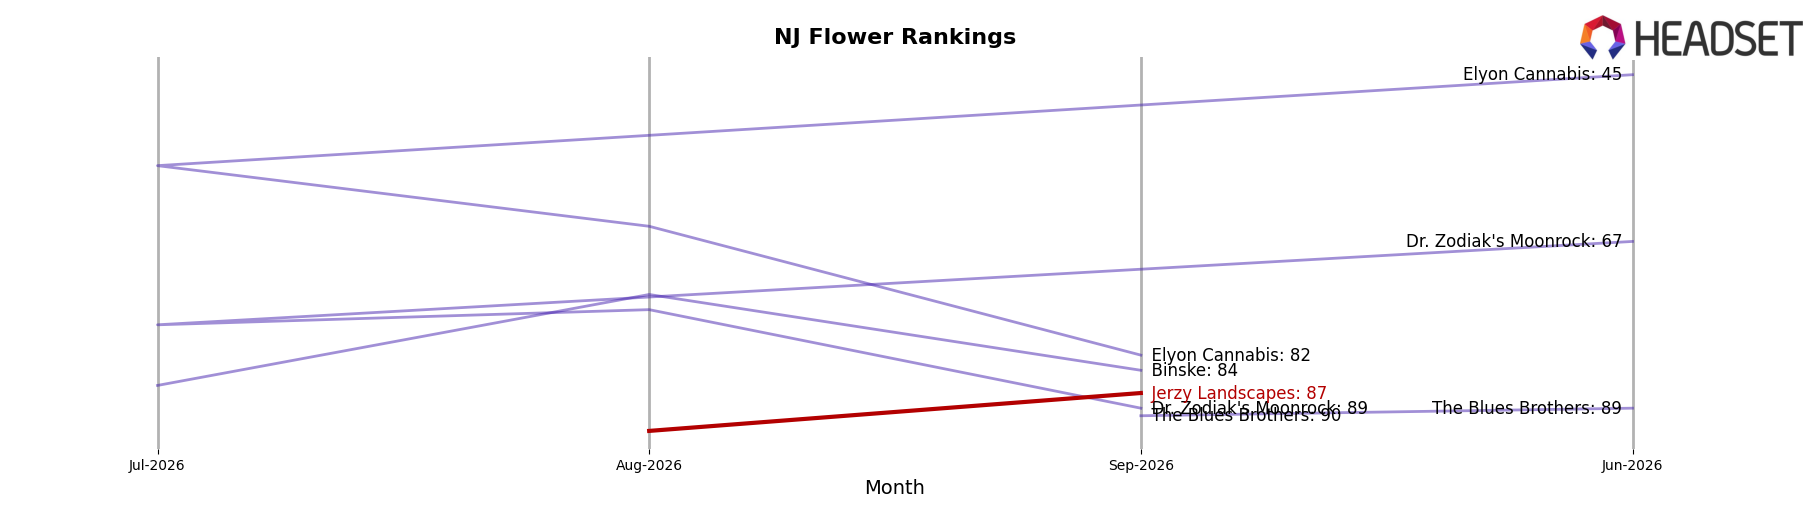
Jerzy Landscapes stands at rank #87 in NJ Flower in September 2026, improving 11 positions year over year from #98 while rising 18 spots since June 2026 from #105; however, this remains 33 places below its peak at #54 in March 2025 and trails the category’s top tier where Find. advanced from #6 to #1 and Good Green climbed from #17 to #3 alongside a 166.7% YoY sales gain. In contrast, RYTHM slipped from #3 to #4 with a 9.8% YoY sales decline while Ozone held at #2 with a 2.8% YoY sales contraction, indicating that Jerzy Landscapes’ upward rank movement amid mixed leader trends suggests a regain of distribution or velocity that is closing the gap from mid-pack but still requires sustained share capture to re-approach its March 2025 peak.
Notable Products
TK Headband Pre-Roll (0.5g) posted the standout move in September 2026 with +112.6% MoM to rank 1, while Apples and Bananas Pre-Roll (1g) fell -66.8% to rank 6, marking a split within the Pre-Roll portfolio. Two other steep declines sat in the top 10 as Hybrid Full Spectrum RSO Syringe (1g) dropped -25.2% at rank 2 and TK Headband Pre-Roll (1g) slid -27.4% at rank 7, indicating volatility clustered at the top ranks. With four of the top ten being Pre-Roll SKUs and Flower holding mid-pack positions at ranks 4 and 5 with -22.7% and +3.3% MoM respectively, the mix implies a pivot toward value-driven, format-led wins where single-SKU spikes can offset broad-category softness.
Top Selling Cannabis Brands






Data for this report comes from real-time sales reporting by participating cannabis retailers via their point-of-sale systems, which are linked up with Headset’s business intelligence software. Headset’s data is very reliable, as it comes digitally direct from our partner retailers. However, the potential does exist for misreporting in the instance of duplicates, incorrectly classified products, inaccurate entry of products into point-of-sale systems, or even simple human error at the point of purchase. Thus, there is a slight margin of error to consider. Brands listed on this page are ranked in the top twenty within the market and product category by total retail sales volume.

