.svg)

Sep-2026
Sales
Trend
6-Month
Product Count
SKUs
Avg Price
YoY Sales Change
YoY Price Change


Market Insights Snapshot
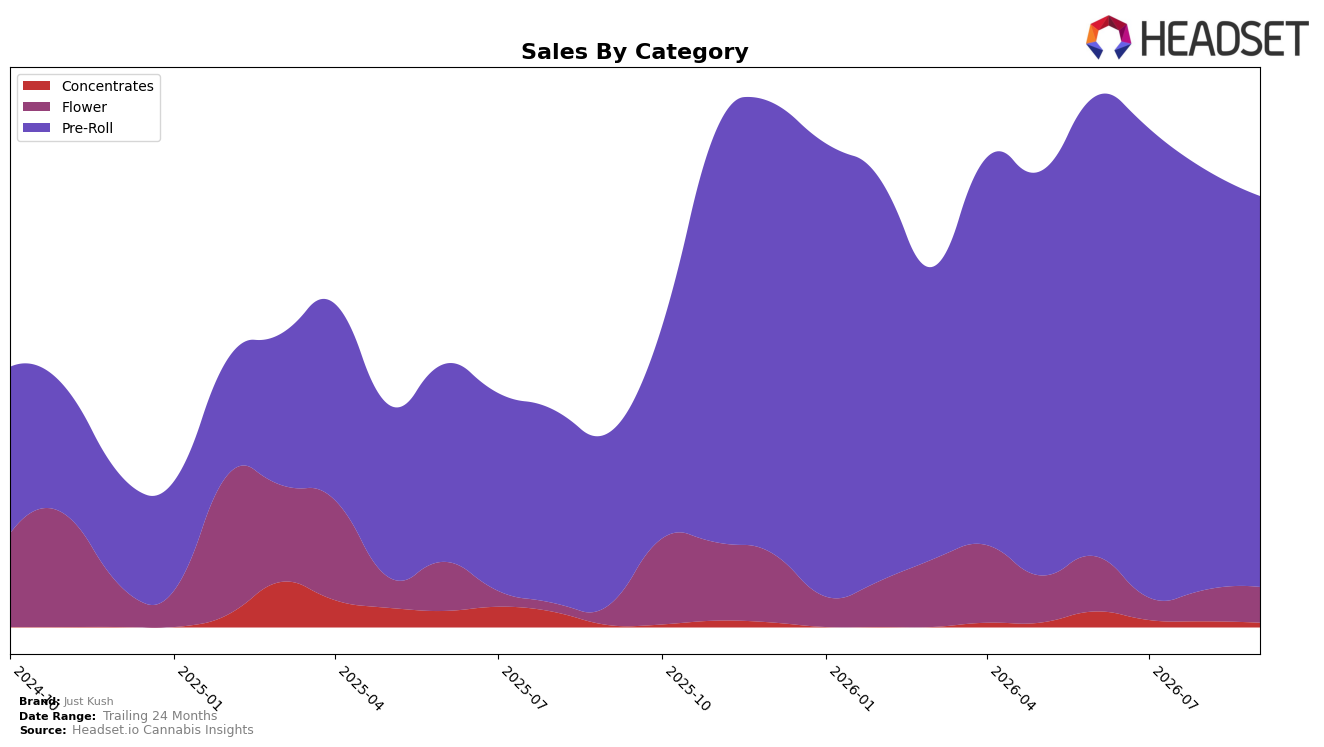
Pre-Roll commanded 90.79% share in September 2026 with year-over-year growth of 126.91% and a month-over-month decline of 7.11%, while Flower held 8.21% share with 85.42% YoY and 14.15% MoM growth. Concentrates contributed 1.01% share with 118.45% YoY growth but a 24.22% MoM drop, and the brand’s average price fell 13.60% YoY to $10.65. In British Columbia, Just Kush sat at rank 50 in Pre-Roll, implying a portfolio concentrated in a single category where scale is building YoY but faces sensitivity to monthly shifts.
The mix suggests Just Kush is leaning on Pre-Roll scale for volume while letting Flower absorb incremental demand, as indicated by Pre-Roll’s 7.11% MoM decline alongside Flower’s 14.15% MoM gain and the overall 126.91% vs. 85.42% YoY split. With Concentrates growing 118.45% YoY yet contracting 24.22% MoM and a 1.01% share, the category remains a niche, and the 13.60% YoY price reduction alongside a rank of 50 in British Columbia Pre-Roll implies a value-forward positioning that trades price for share concentration, with Flower acting as the near-term hedge against Pre-Roll’s monthly volatility.
Competitive Landscape
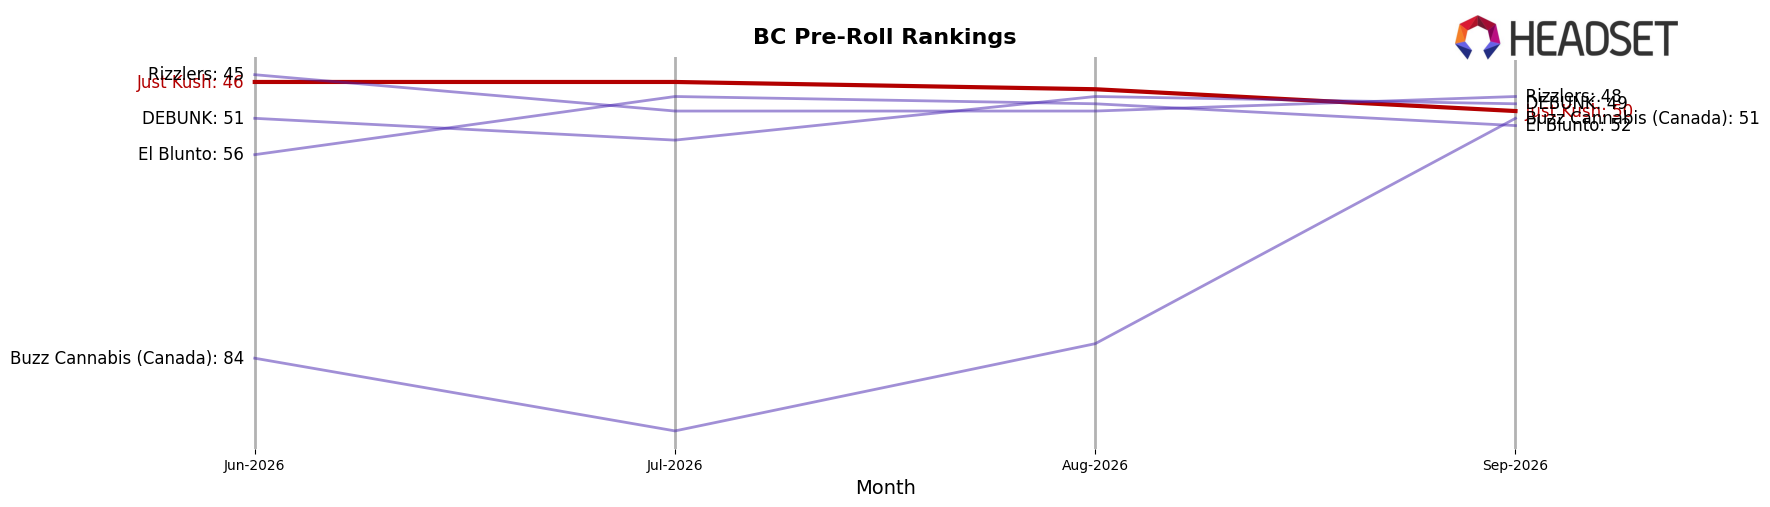
Just Kush sits at rank #50 in BC Pre-Roll in September 2026, improving 24 positions year over year from #74 while sliding 4 spots from June 2026’s #46; against a longer view, the brand is 15 places below its peak of #35 from October 2025 and 1 place lower than the prior quarter’s best, indicating recent slippage amid a longer YoY climb. In the same period, Weed Me advanced from #2 to #1 with a 28.6% YoY sales increase, while Back Forty / Back 40 Cannabis surged from #13 to #2 on 197.3% YoY growth, outpacing Just Kush’s rank momentum and compressing headroom near the top. The pattern implies Just Kush’s YoY ascent is real but its quarter-to-quarter drift and competitor acceleration point to a plateau risk unless near-term share gains re-accelerate.
Notable Products
Mach 1 (7g) posted the steepest decline at -64.3% Month over Month, sliding to rank 10, while Five Fires Pre-Roll 5-Pack (5g) fell -24.0% to rank 4, signaling a pivot away from larger formats toward singles. At the top, Durban Lemon Poison Pre-Roll (1g) rose +10.9% to rank 1 as VIP Kush Pre-Roll (1g) dipped -8.0% at rank 2, and Mach 1 Pre-Roll (1g) climbed +11.5% to rank 3, concentrating demand at the very top of the Pre-Roll ladder. Seven of the top ten are Pre-Rolls, and the only Concentrates entry, Mach 1 Live Rosin (1g), dropped -24.2% to rank 9 while the Heaviez GCG Pre-Roll (2g) surged +41.2% at rank 8, indicating consumer spend is consolidating into value and single-stick inhalables rather than premium extracts or multi-pack formats.
Top Selling Cannabis Brands






Data for this report comes from real-time sales reporting by participating cannabis retailers via their point-of-sale systems, which are linked up with Headset’s business intelligence software. Headset’s data is very reliable, as it comes digitally direct from our partner retailers. However, the potential does exist for misreporting in the instance of duplicates, incorrectly classified products, inaccurate entry of products into point-of-sale systems, or even simple human error at the point of purchase. Thus, there is a slight margin of error to consider. Brands listed on this page are ranked in the top twenty within the market and product category by total retail sales volume.

