.svg)

Sep-2026
Sales
Trend
6-Month
Product Count
SKUs
Avg Price
YoY Sales Change
YoY Price Change


Where to Buy
Made By A Farmer is stocked at 184 licensed dispensaries across Michigan, with the deepest coverage in New Buffalo, Detroit, Grand Rapids, Muskegon, and Flint. Search by ZIP code or city below to find the closest one, or filter by product type if you are after a specific format.
Market Insights Snapshot
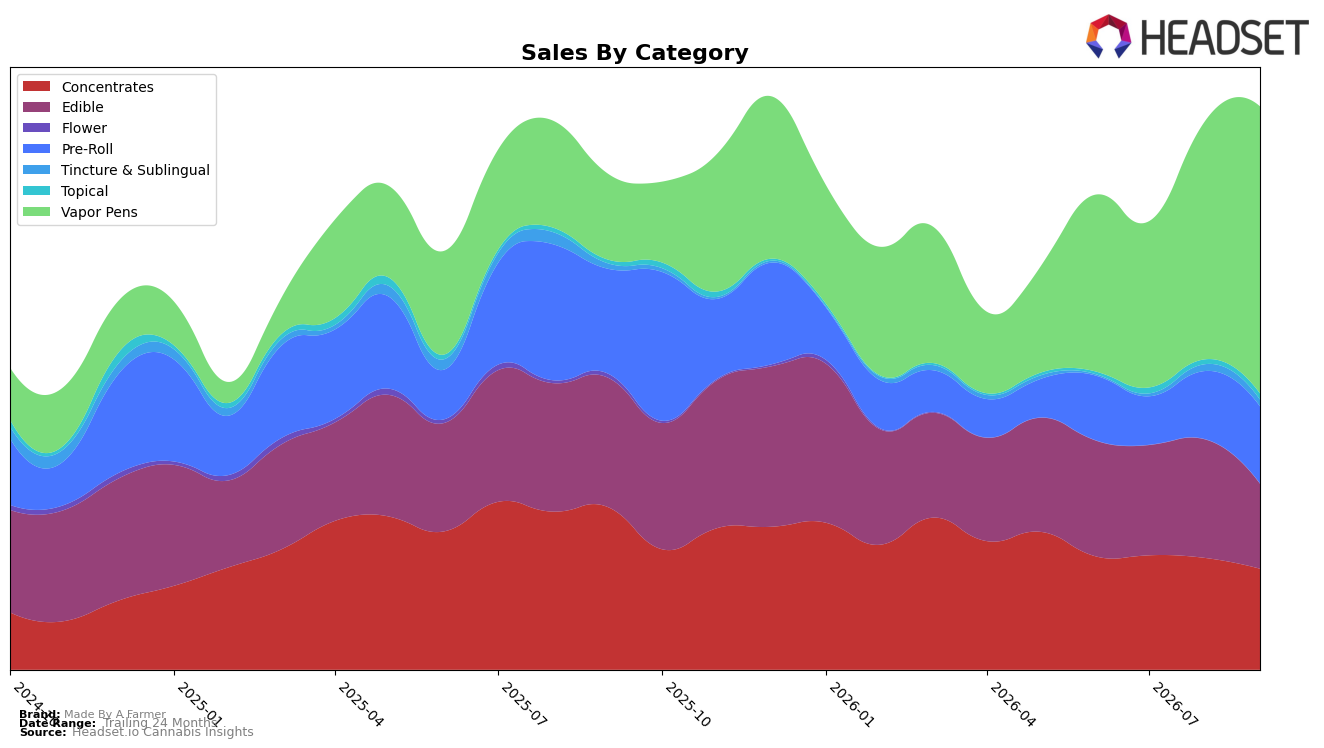
Made By A Farmer shifted decisively toward Vapor Pens in September 2026, with the segment holding a 51.07% mix share and growing 235.31% year over year alongside a 20.78% month-over-month lift, while Pre-Roll rose 13.54% MoM despite a 26.53% YoY decline. In contrast, Concentrates fell 37.89% YoY and 9.71% MoM to 17.96% share, and Edible contracted 34.41% YoY and 28.40% MoM to 15.08% share; smaller formats diverged, as Topical advanced 70.39% YoY and 27.72% MoM versus Tincture & Sublingual up 26.75% YoY but down 0.51% MoM. With Vapor Pens also carrying a higher average price at $26.01 versus the brand’s overall $13.30 and Tincture & Sublingual at $28.20, the mix indicates a pivot toward higher-ticket inhalables while price-sensitive ingestibles retreat, a setup that concentrates revenue density into one lead category.
This reweighting puts Made By A Farmer’s positioning closer to inhalable-led baskets, where Vapor Pens growth can offset drag in Edible and Concentrates, but it also raises category concentration risk given a Vapor Pens rank of 45 in Michigan and a simultaneous 24.99% YoY increase in average price that could pressure trial in value-focused segments. The contrasting momentum—Topical up 27.72% MoM at a 1.05% share and Pre-Roll up 13.54% MoM at a 13.69% share—suggests a secondary pathway to stabilize mix if pen growth normalizes, while the 9.71% MoM slide in Concentrates and the 28.40% MoM slide in Edible imply that discount-led recovery would need sharper price or format repositioning. Net effect: the brand is trading breadth for depth, leveraging a 235.31% YoY surge in Vapor Pens to drive a 13.68% YoY sales lift overall, but sustaining that path will depend on converting rank 45 into higher distribution and defending margin as average prices climb.
Competitive Landscape
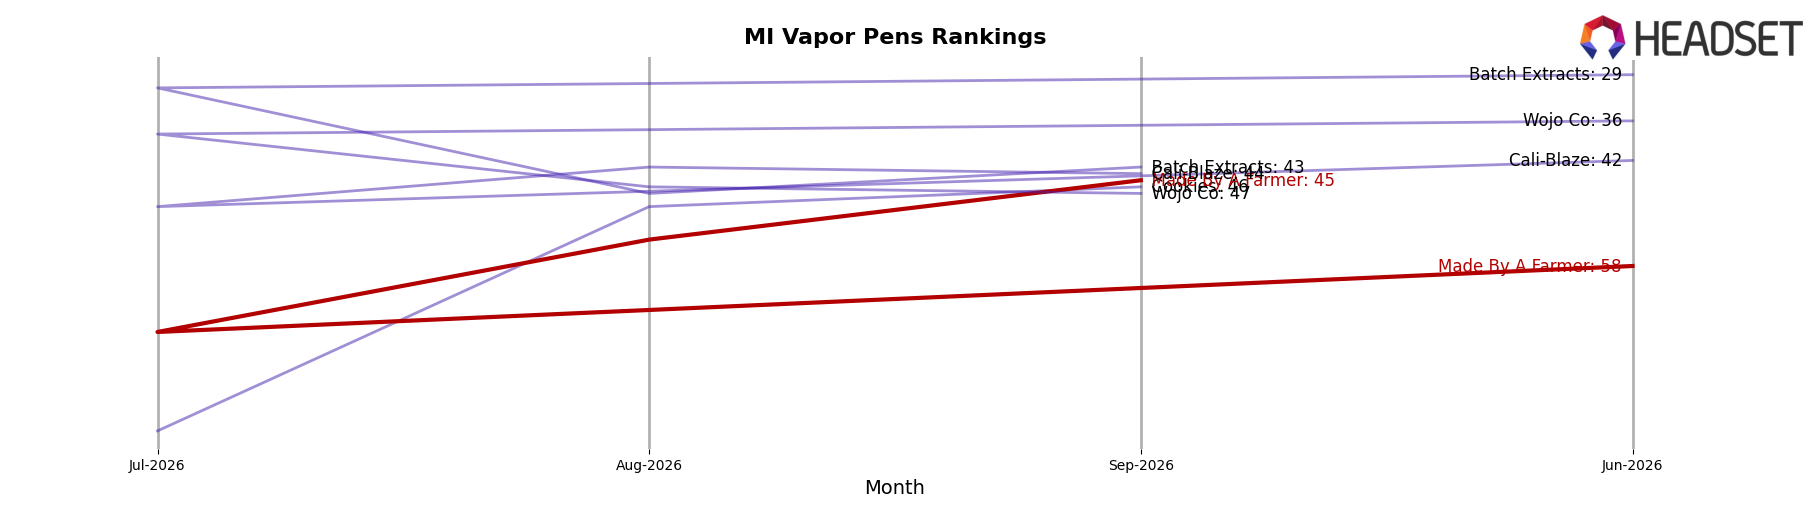
Made By A Farmer sits at rank #45 in Michigan Vapor Pens in September 2026 after climbing 42 positions from #87 year over year, and it advanced 13 spots from #58 in June 2026 to reach a peak at #45 in September 2026; by contrast, MKX Oil Company moved from #3 to #1 while growing sales by 21.7%, and Mitten Extracts slipped from #1 to #2 alongside a 12.9% sales decline. This rank trajectory—up 42 places YoY and 13 quarter-over-quarter—implies Made By A Farmer is transitioning from fringe placement toward the competitive mid-pack, where sustaining share will require converting recent momentum into steadier monthly rank stability.
Notable Products
THC/CBN 1:1 Grape Full Spectrum Nano Vegan Gummies 10-Pack (200mg THC, 200mg CBN) posted the steepest move in September 2026 with a -65.0% month-over-month decline while holding rank 4, signaling a sharp pullback in sleep-oriented formulations even as Grape Breath Hash Rosin Gummies 2-Pack (200mg) in rank 1 inched up 3.9%. CBD/THC 1:1 Strawberry Kiwi Full Spectrum Nano Vegan Full Spectrum Gummies 10-Pack (200mg CBD, 200mg THC) also slid -18.1% at rank 5, whereas Green Apple Fast Acting Gummies 10-Pack (200mg) climbed 33.5% at a parallel rank 5, pointing to a tilt toward fast-acting THC over ratio SKUs. Four of the top ten are Edible SKUs concentrated in ranks 1–7, yet the single largest revenue driver within the set is a Vapor Pens item at rank 3, creating a split where units concentrate in edibles but dollars lean into inhalable formats, with one disposable exceeding $24,000 in September 2026. The pattern implies Made By A Farmer is pivoting assortment and demand toward immediate-effect gummies and higher-ticket disposables, while de-emphasizing 1:1 and CBN-heavy formulations.
Top Selling Cannabis Brands






Data for this report comes from real-time sales reporting by participating cannabis retailers via their point-of-sale systems, which are linked up with Headset’s business intelligence software. Headset’s data is very reliable, as it comes digitally direct from our partner retailers. However, the potential does exist for misreporting in the instance of duplicates, incorrectly classified products, inaccurate entry of products into point-of-sale systems, or even simple human error at the point of purchase. Thus, there is a slight margin of error to consider. Brands listed on this page are ranked in the top twenty within the market and product category by total retail sales volume.

