Jun-2026
Sales
Trend
6-Month
Product Count
SKUs
Avg Price
YoY Sales Change
YoY Price Change
Market Insights Snapshot
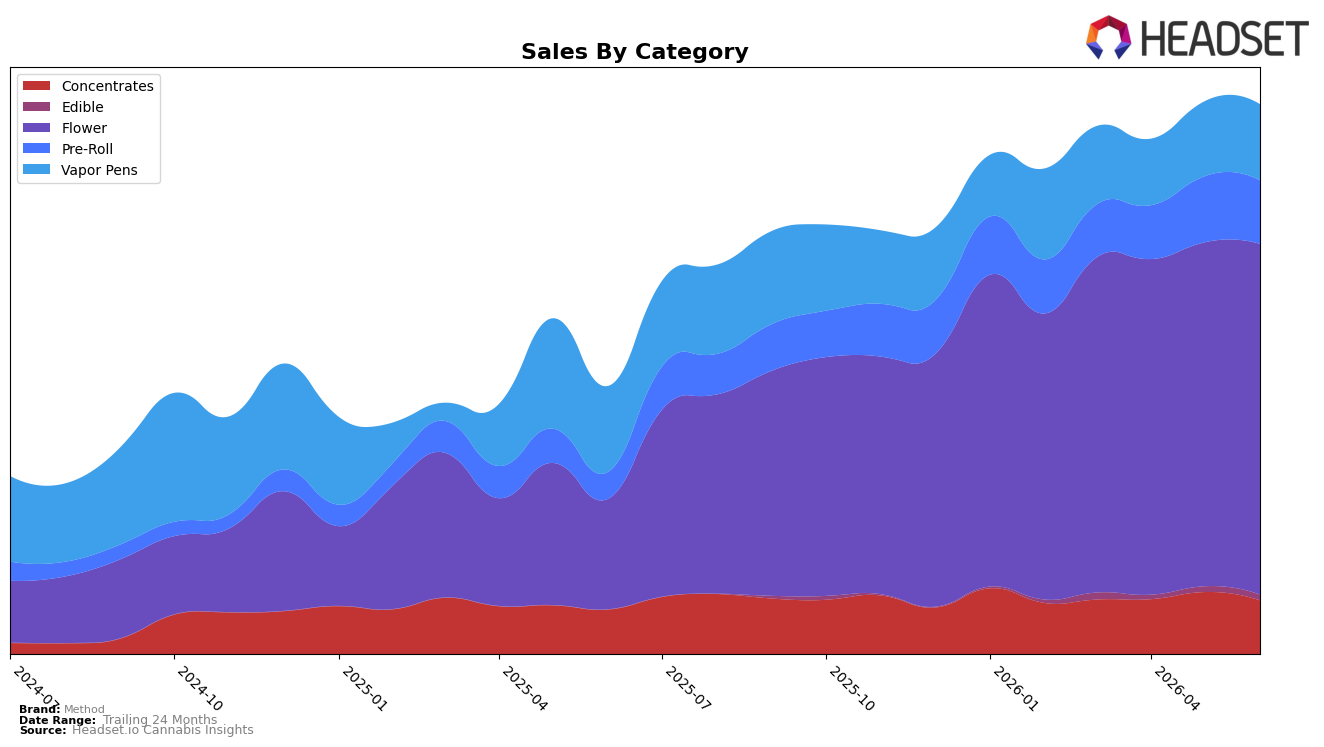
Method’s mix in June 2026 is concentrated in Flower at 63.9% share with 217.9% year-over-year growth and 2.0% month-over-month, while Vapor Pens sit at 13.8% share with -11.3% year-over-year and 1.5% month-over-month. Pre-Roll holds 11.5% share with 137.5% year-over-year and -4.0% month-over-month, and Concentrates at 9.8% share show 20.8% year-over-year with a -13.4% month-over-month decline; Edible remains marginal at 1.0% share with 0.3% month-over-month. With overall brand sales up 105.6% year-over-year and average price up 15.3%, the skew toward Flower and Pre-Roll is pulling mix toward higher-volume inhalables, implying a category-led expansion rather than price-only lift.
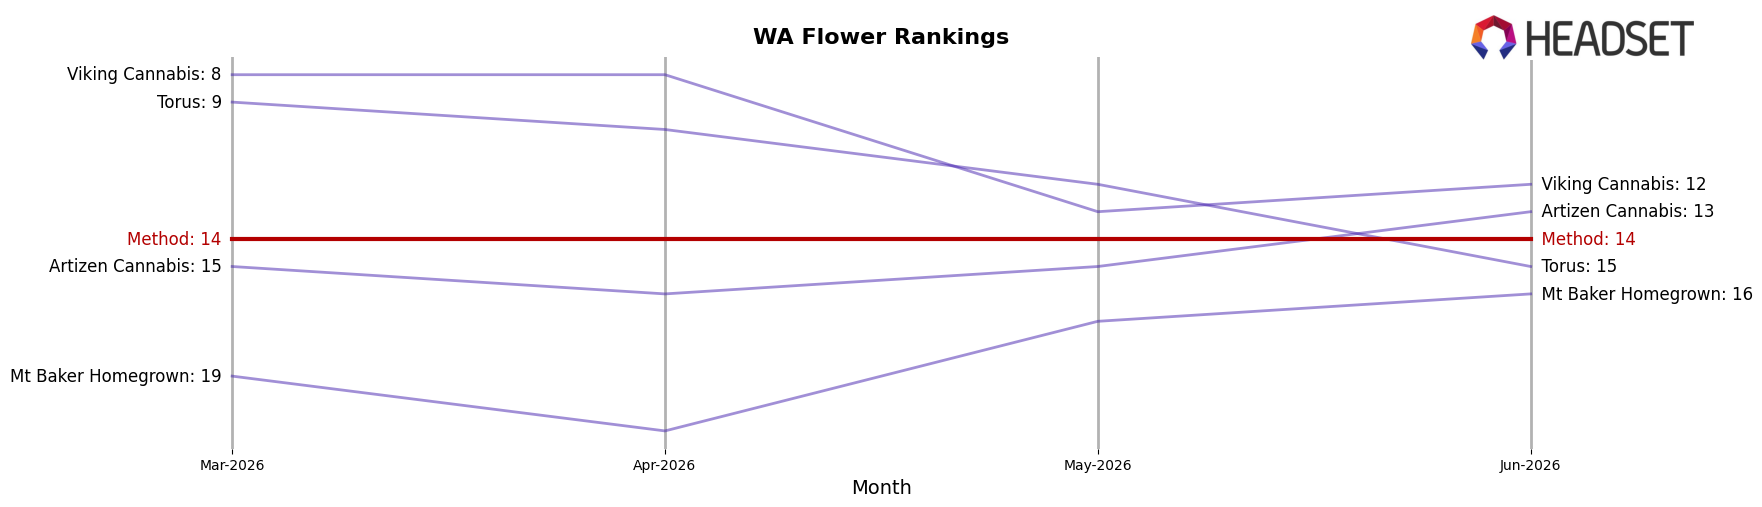
These shifts point to a positioning anchored in core inhalables, where a 63.9% Flower share and a 137.5% year-over-year surge in Pre-Roll offset a -11.3% Vapor Pens year-over-year. The -13.4% month-over-month in Concentrates alongside a -4.0% month-over-month in Pre-Roll suggests short-term trade-down or substitution toward Flower, which still grew 2.0% month-over-month; coupled with a 15.3% average price increase and a 14th rank in Flower in Washington, the pattern implies Method can consolidate mid-tier Flower share while reallocating effort from declining or volatile segments to sustain double-digit year-over-year brand growth.
Competitive Landscape
Method sits at rank #14 in Washington Flower in June 2026, improving 40 positions year over year from #54 to #14 while holding steady versus March 2026 at #14; this marks its peak rank to date at #14 in June 2026. Against competitors, Phat Panda held #1 year over year with a 16.6% sales lift while Method climbed 74% of the ranking ladder positions compared with a year ago, and Legends stayed at #2 even as its sales fell 19.8% year over year, indicating Method’s ascent is rank-driven rather than dependent on category-wide tailwinds. Meanwhile, Lifted Cannabis Co advanced from #8 to #3 alongside a 17.9% sales increase, and Sweetwater Farms moved from #17 to #5 with a 65.8% uptick, suggesting that Method’s flat three-month rank at #14 amid rapid upward shifts by peers implies share consolidation below the top tier unless additional momentum converts into further rank gains.
Notable Products
Method’s GG #4 Pre-Roll 2-Pack (1g) delivered the most notable movement in June 2026 with a +28.8% month-over-month jump into rank 2, while Gorilla Glue #4 (3.5g) held rank 1 with +12.4% MoM growth, and Jaffa (3.5g) advanced with +10.5% at rank 5. Flower concentrates the chart with six of the top ten SKUs, and Gorilla Glue #4 (3.5g) alone contributed $24,810, indicating the brand’s gains are anchored in core eighths while pre-rolls add incremental velocity; the mix implies Method is steadily deepening flagship strain equity while expanding entry-price formats for wider basket capture.
Top Selling Cannabis Brands
Data for this report comes from real-time sales reporting by participating cannabis retailers via their point-of-sale systems, which are linked up with Headset’s business intelligence software. Headset’s data is very reliable, as it comes digitally direct from our partner retailers. However, the potential does exist for misreporting in the instance of duplicates, incorrectly classified products, inaccurate entry of products into point-of-sale systems, or even simple human error at the point of purchase. Thus, there is a slight margin of error to consider. Brands listed on this page are ranked in the top twenty within the market and product category by total retail sales volume.

