Mar-2026
Sales
Trend
6-Month
Product Count
SKUs
Avg Price
YoY Sales Change
YoY Price Change
Market Insights Snapshot
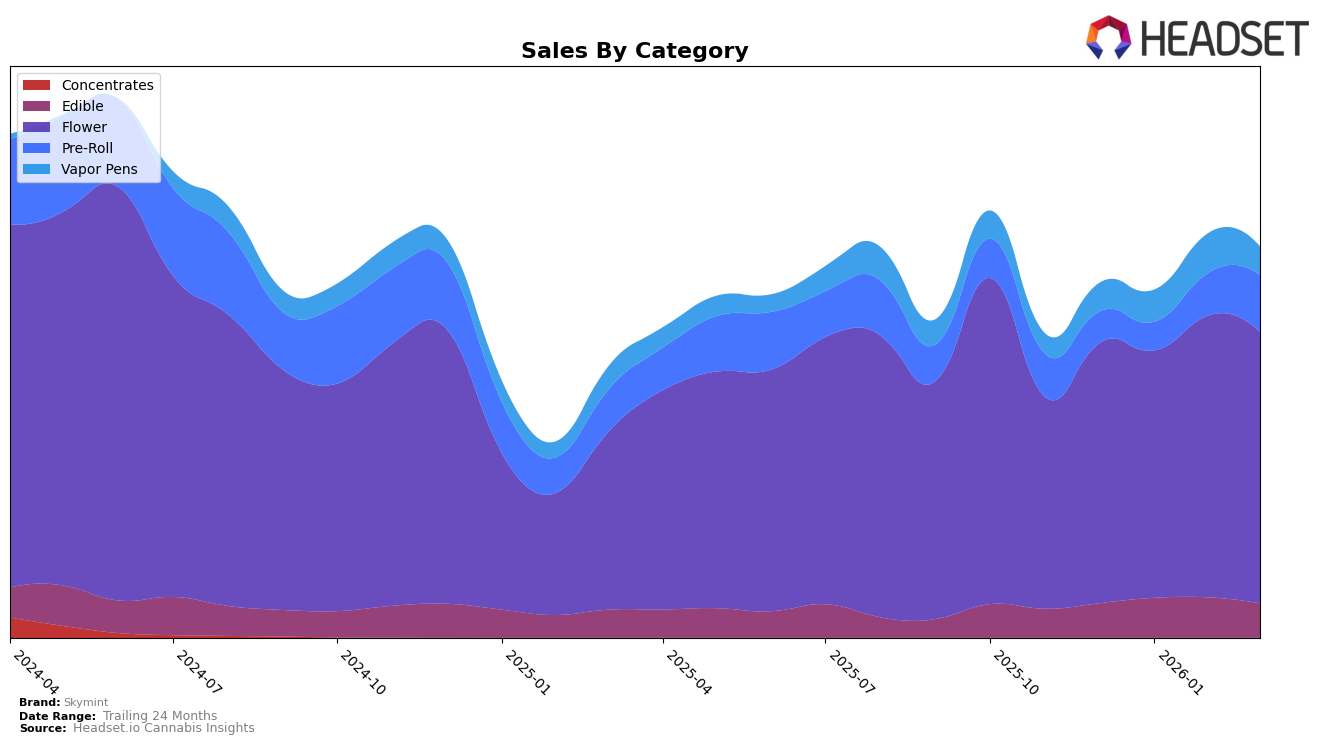
In the state of Michigan, Skymint's performance across various cannabis categories has shown some interesting trends. In the Flower category, Skymint has maintained a relatively stable presence, with rankings fluctuating between 24th and 29th place from December 2025 to March 2026. This suggests a consistent demand for their flower products, with a notable peak in sales during February 2026. However, the Edible category tells a different story, as Skymint did not make it into the top 30 brands, indicating a potential area for growth or a need to reassess their strategy in this segment.
Skymint's performance in the Pre-Roll category has seen significant improvement, moving from a rank of 89th in December 2025 to 54th by March 2026. This upward trajectory highlights growing consumer interest and possibly successful product offerings or marketing strategies in this category. Conversely, in the Vapor Pens category, Skymint's ranking has seen some volatility, with a slight dip in March 2026 compared to earlier months. While the sales figures show fluctuations, the brand's ability to remain within the top 100 suggests a steady consumer base, albeit with room for further market penetration or innovation.
Competitive Landscape
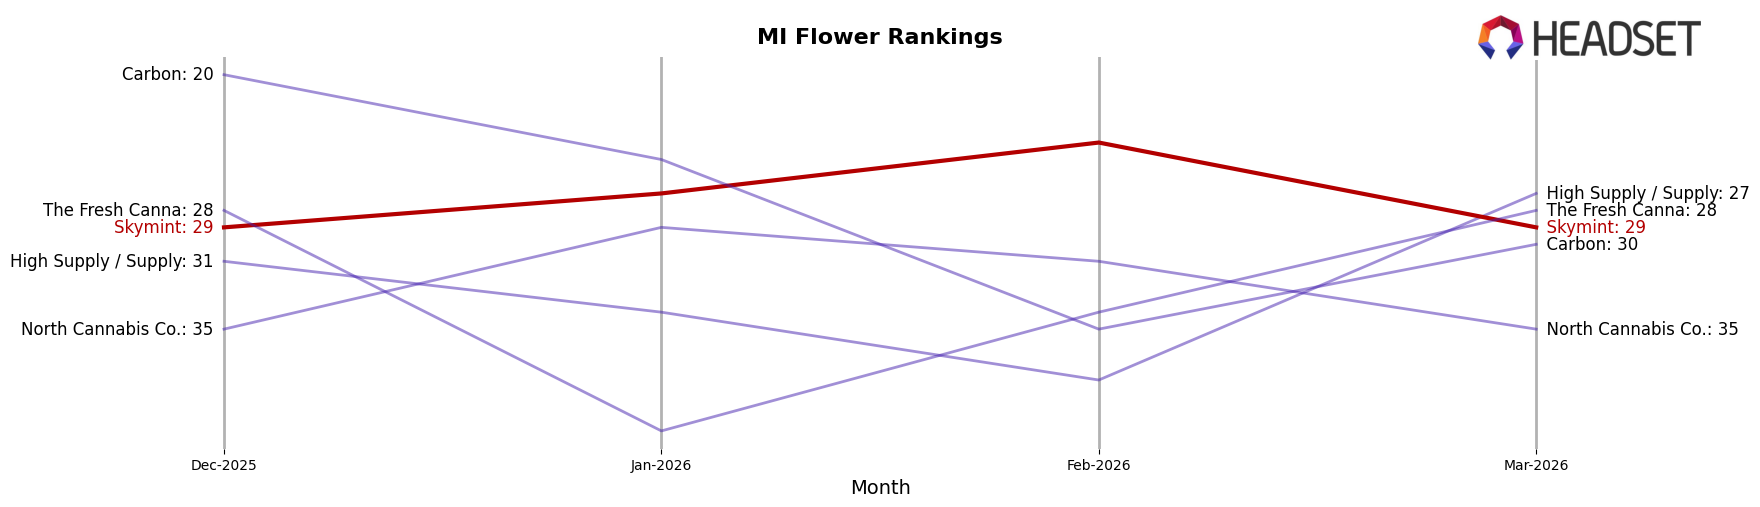
In the competitive landscape of the Michigan flower category, Skymint has demonstrated a notable fluctuation in its ranking over the months from December 2025 to March 2026. Skymint's rank improved from 29th in December 2025 to 24th in February 2026, before slightly declining to 29th again in March 2026. This indicates a competitive environment where Skymint is maintaining a relatively stable position amidst fluctuations. In comparison, Carbon experienced a more significant drop from 20th to 30th, suggesting potential challenges in sustaining its earlier momentum. Meanwhile, High Supply and North Cannabis Co. have not been consistent contenders in the top 20, with ranks mostly outside this range, indicating less competitive pressure from these brands. Skymint's sales figures show a peak in February 2026, aligning with its best rank, which could be a result of effective marketing strategies or product offerings during that period. This competitive analysis underscores the importance of strategic positioning and adaptability in the dynamic Michigan flower market.
Notable Products
In March 2026, the top-performing product for Skymint was Wedding Cake (3.5g) in the Flower category, maintaining its number one rank from February with sales reaching 7624. Honey Buns Pre-Roll (1g) made a significant entry into the top rankings, securing the second spot. The THC:CBN 5:1 Night Berry Gummies 10-Pack, an Edible, slipped to third place from its previous second position in February. Honey Buns (3.5g) climbed to fourth place, improving from third in February. Strawberry Lemonade Live Resin Gummies 20-Pack, another Edible, rounded out the top five, having moved up from fourth place in February, showing steady growth in sales figures.
Top Selling Cannabis Brands
Data for this report comes from real-time sales reporting by participating cannabis retailers via their point-of-sale systems, which are linked up with Headset’s business intelligence software. Headset’s data is very reliable, as it comes digitally direct from our partner retailers. However, the potential does exist for misreporting in the instance of duplicates, incorrectly classified products, inaccurate entry of products into point-of-sale systems, or even simple human error at the point of purchase. Thus, there is a slight margin of error to consider. Brands listed on this page are ranked in the top twenty within the market and product category by total retail sales volume.

