.svg)


Market Insights Snapshot
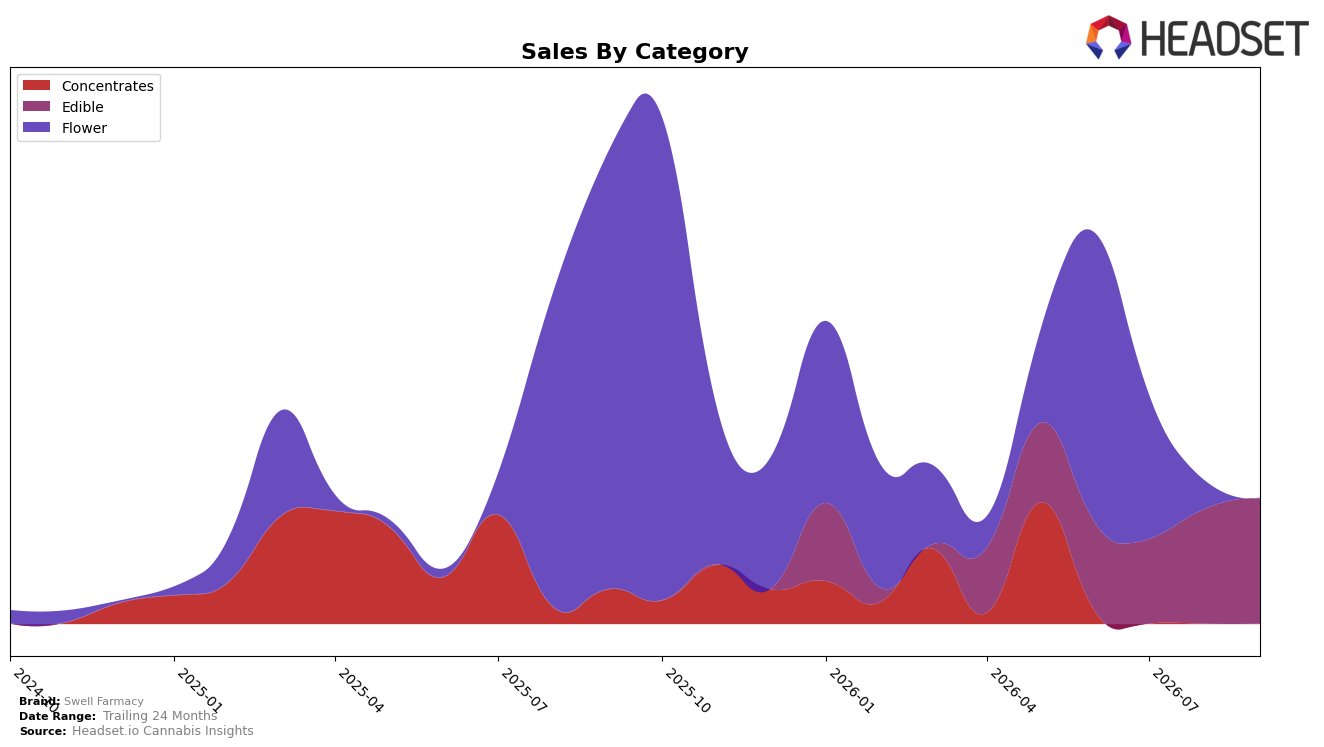
Swell Farmacy concentrated 99.65% of September 2026 sales in Edible, with Flower reduced to 0.35% share, a mix shift reinforced by a 9.12% month-over-month gain in Edible alongside a 98.43% MoM decline in Flower. Year over year, Flower contracted by 99.90%, and brand-level pricing fell 79.26%, while Swell Farmacy held rank 28 in Edible within Arizona; taken together, the portfolio has pivoted almost entirely into low-priced Edible to stabilize volume while exiting Flower.
The move to a 99.65% Edible mix in September 2026 coupled with an average price near $4.45 and a 9.12% Edible MoM lift implies a value-led positioning that prioritizes velocity over ticket size, even as overall sales were down 73.43% year over year. With Flower effectively de-prioritized (98.43% MoM and 99.90% YoY declines) and a category rank of 28 in Arizona Edible, the brand is trading depth in fewer categories for price-accessible penetration within Edible, aiming to regain share through frequency rather than premium pricing.
Competitive Landscape
Swell Farmacy sits at rank #28 in AZ Edible in September 2026, improving 7 positions from #35 in June 2026, while hitting a new peak rank of #28 in September 2026; against this backdrop, category leaders moved in mixed directions as Wyld held #1 with a 1-year rank change of 0 but posted a -16.2% sales YoY decline and Baked Bros climbed from #4 to #2 with +22.5% sales YoY. Additional shifts show OGEEZ sliding from #2 to #3 with -8.0% sales YoY and Wana steady at #5 with +14.4% sales YoY, indicating that Swell Farmacy’s 7-rank climb over three months is occurring amid leadership churn where momentum is accruing to brands improving both rank and growth; the pattern implies Swell Farmacy’s recent ascent is opportunistic—gaining share as incumbents either stall or contract—and suggests near-term upside if it can convert rank gains into sustained velocity.

Notable Products
Berry Peach Gummies (100mg) posted the standout movement in September 2026 with a +61.98% month-over-month surge to rank 1, while Strawberry Banana Gummies (100mg) fell -29.31% and slid to rank 4. Grape Watermelon Gummies (100mg) advanced +21.42% to rank 2, and Apple Mango Gummies (100mg) was nearly flat at -0.55% while holding rank 3. Four of the top ten are Edible SKUs concentrated at ranks 1–4, and Flower entries Royal Cake (14g) at rank 5 and Death by Citrus (14g) at rank 6 signal a bifurcated mix where Edibles drive velocity and Flower faces drastic variability, implying Swell Farmacy’s near-term growth is anchored in Edibles while Flower requires SKU rationalization.
Top Selling Cannabis Brands






Data for this report comes from real-time sales reporting by participating cannabis retailers via their point-of-sale systems, which are linked up with Headset’s business intelligence software. Headset’s data is very reliable, as it comes digitally direct from our partner retailers. However, the potential does exist for misreporting in the instance of duplicates, incorrectly classified products, inaccurate entry of products into point-of-sale systems, or even simple human error at the point of purchase. Thus, there is a slight margin of error to consider. Brands listed on this page are ranked in the top twenty within the market and product category by total retail sales volume.

