May-2026
Sales
Trend
6-Month
Product Count
SKUs
Avg Price
YoY Sales Change
YoY Price Change
Market Insights Snapshot
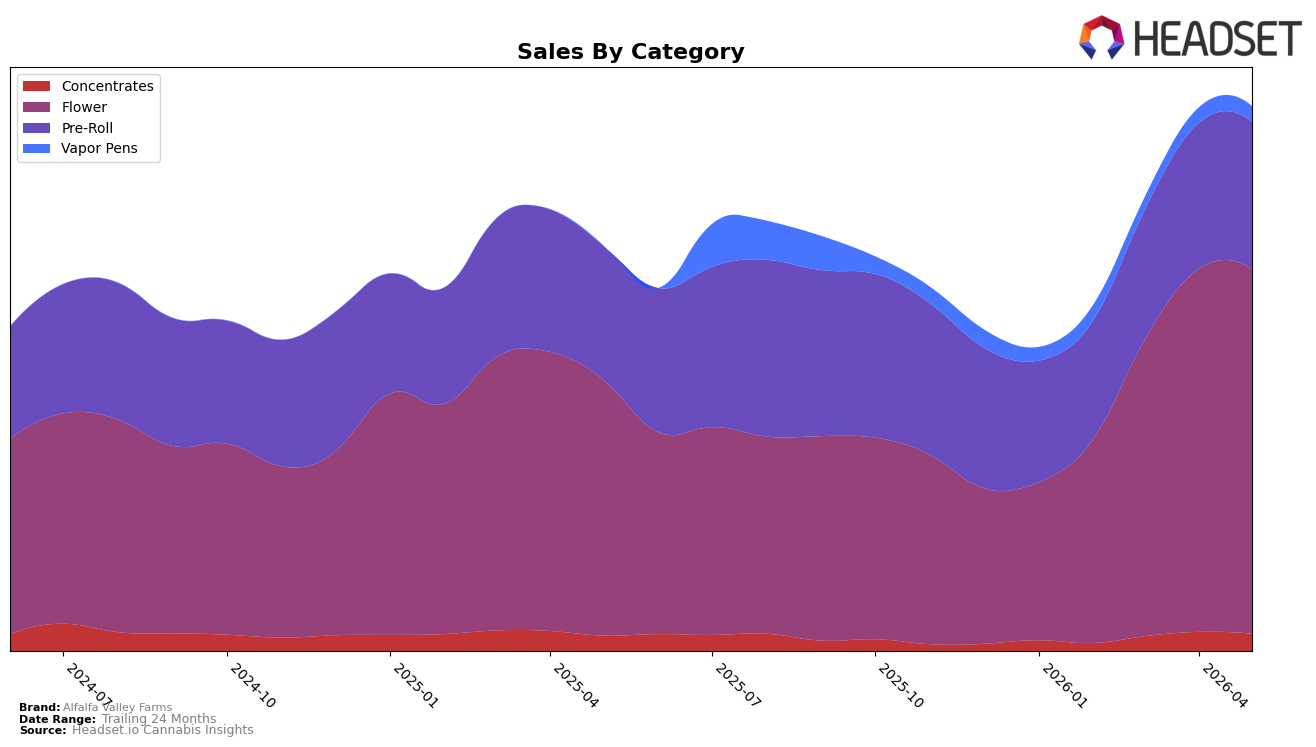
In May 2026, Alfalfa Valley Farms concentrated 66.97% of sales in Flower with a 42.65% year-over-year increase and a 0.46% month-over-month lift, while Pre-Roll held 26.98% share with 9.76% YoY growth and a 0.73% MoM rise. Smaller lines moved unevenly: Concentrates at 3.17% share advanced 12.42% YoY but declined 9.35% MoM, and Vapor Pens at 2.88% share added 3.25% MoM with no YoY read. Average price rose 38.69% YoY alongside 34.50% brand-level YoY sales growth, and the brand’s top state was Oregon with Flower ranked 18. Taken together, the mix skews toward higher-priced Flower and steady Pre-Roll, implying near-term volume resilience with pricing power anchored in Flower while peripheral categories contribute marginally and add volatility risk.
The category tilt indicates positioning as a Flower-led brand competing on price-per-unit and assortment breadth: Flower’s 66.97% share coupled with a 42.65% YoY gain outpacing the overall 34.50% YoY suggests the brand’s edge concentrates where it ranks 18 in Oregon, whereas Pre-Roll’s 26.98% share and 0.73% MoM rise serve as a stabilizer. The 9.35% MoM drop in Concentrates versus a 3.25% MoM rise in Vapor Pens signals that non-core innovation should prioritize Vapor Pens over Concentrates for incremental share, and the 38.69% YoY average price increase with continued growth points to pricing headroom that can be leveraged in Flower without materially eroding MoM momentum.
Competitive Landscape
Alfalfa Valley Farms sits at rank #18 in OR Flower in May 2026 after a 12-position YoY climb from #30, and it also advanced 14 spots from #32 three months ago to reach its peak rank of #18 in May 2026; against this, PRUF Cultivar / PRŪF Cultivar held at #1 with a 0-position YoY change while Grown Rogue moved up from #7 to #2 with a 5-position improvement and 51.1% YoY sales growth, indicating that Alfalfa Valley Farms’ rapid rank acceleration into the top 20 is occurring amid top-tier competitors consolidating at #1–#2, which implies the brand’s trajectory is upward but will require sustained share gains to close the gap to the leaders.

Notable Products
Diamond Runts Pre-Roll (0.5g) posted the steepest movement in May 2026 at -71.6% MoM, sliding to rank 9 while Pineapple Cake Pre-Roll (1g) fell 19.4% MoM at rank 8. In contrast, Jealousy Mints Pre-Roll (0.5g) climbed 31.5% MoM to rank 4 and MAC 1 Pre-Roll (0.5g) rose 16.8% MoM to rank 5. With six of the top ten SKUs in the Pre-Roll category and Triple Burger Pre-Roll (0.5g) holding rank 1 on a 7.1% MoM gain, the mix points to a strategy concentrating around pre-roll velocity despite volatility at the lower end.
Top Selling Cannabis Brands
Data for this report comes from real-time sales reporting by participating cannabis retailers via their point-of-sale systems, which are linked up with Headset’s business intelligence software. Headset’s data is very reliable, as it comes digitally direct from our partner retailers. However, the potential does exist for misreporting in the instance of duplicates, incorrectly classified products, inaccurate entry of products into point-of-sale systems, or even simple human error at the point of purchase. Thus, there is a slight margin of error to consider. Brands listed on this page are ranked in the top twenty within the market and product category by total retail sales volume.

