.svg)

Aug-2026
Sales
Trend
6-Month
Product Count
SKUs
Avg Price
YoY Sales Change
YoY Price Change


Where to Buy
Blackstone Valley Cannabis is stocked at 30 licensed dispensaries across Massachusetts, with the deepest coverage in Worcester, Abington, Amherst, Arlington, and Belchertown. Search by ZIP code or city below to find the closest one, or filter by product type if you are after a specific format.
Market Insights Snapshot
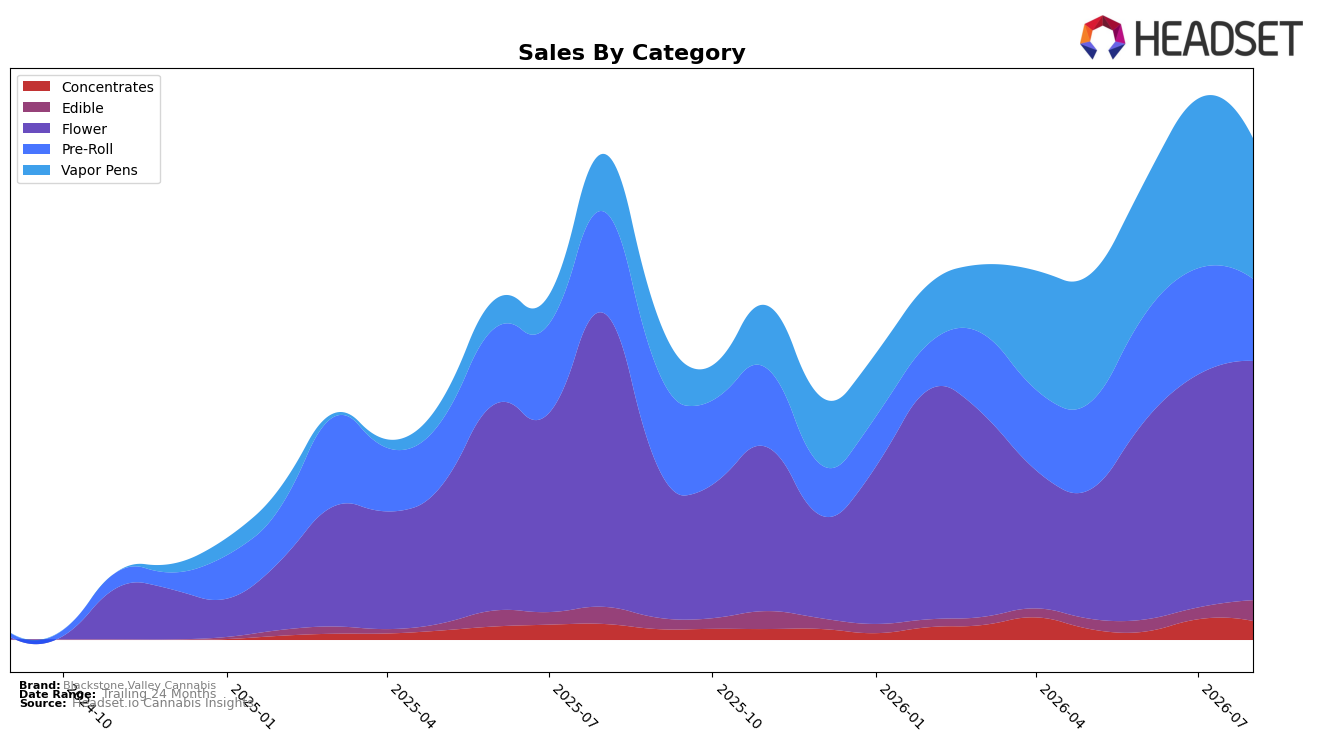
In August 2026, Blackstone Valley Cannabis leaned heavily on Flower at 47.75% share while holding rank 51 in Massachusetts Flower, even as Flower sales fell 18.57% year over year and ticked up 2.70% month over month; Vapor Pens rose to 28.03% mix with a 144.11% year-over-year surge but slid 17.15% month over month. Pre-Roll contracted to 16.37% share with a 19.15% year-over-year decline and a 22.79% month-over-month drop, while Edible expanded to 4.11% share on 22.06% year-over-year growth and a 78.46% month-over-month jump; Concentrates held 3.74% share with 18.83% year-over-year growth and an 8.54% month-over-month dip. The mix indicates a pivot from historically dominant Flower toward inhalables diversification, with Edible acting as the near-term stabilizer given its outsized month-over-month acceleration despite overall brand sales up only 3.21% year over year and average price down 1.28%.
The combined 17.15% month-over-month decline in Vapor Pens alongside a 22.79% month-over-month drop in Pre-Roll suggests exposure to volatility in quick-turn inhalables, while the 2.70% month-over-month lift in Flower and 78.46% month-over-month spike in Edible indicate counterbalancing demand pockets. With Flower down 18.57% year over year but still at 47.75% share, and Vapor Pens up 144.11% year over year to 28.03% mix, positioning skews toward value-accessible inhalables as average price contracted 1.28%; this implies the brand can trade price for volume where rank 51 in Massachusetts Flower limits premium leverage, making Edible and Concentrates’ 22.06% and 18.83% year-over-year growth the practical avenues to smooth revenue while Flower and Pre-Roll remain capacity anchors rather than growth engines.
Competitive Landscape
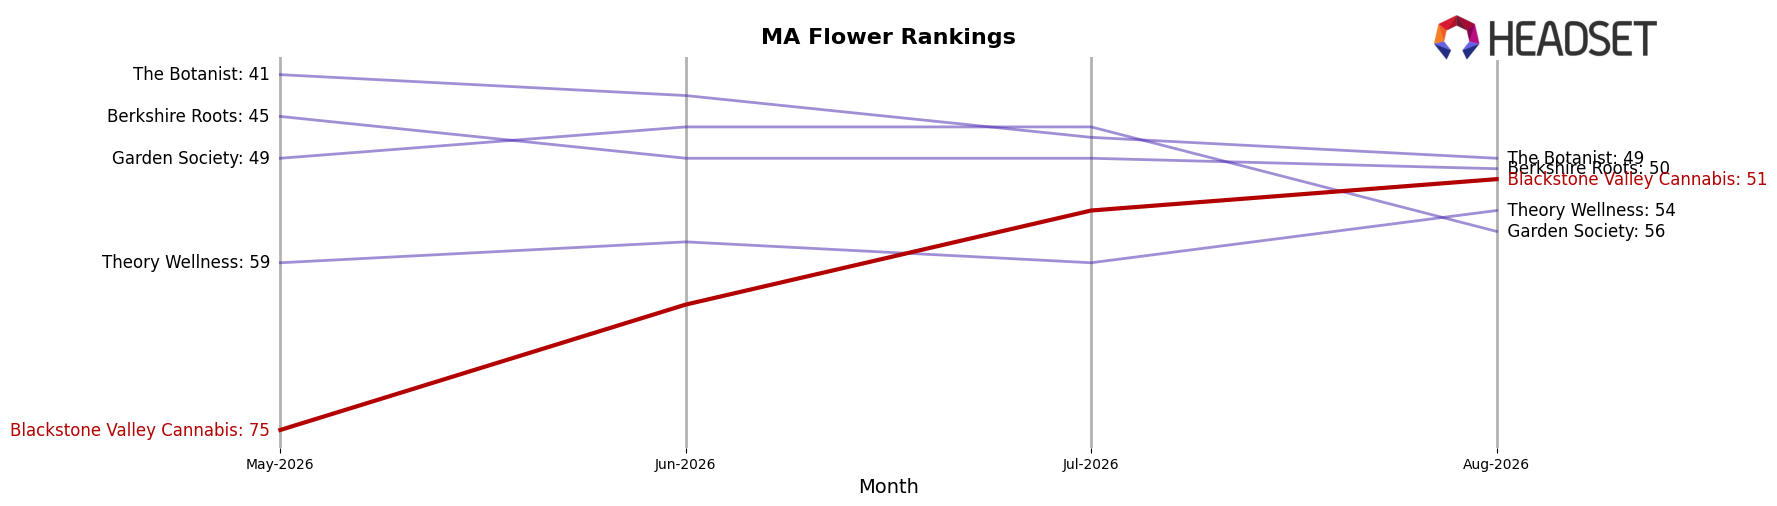
Blackstone Valley Cannabis is ranked #51 in MA Flower in August 2026, flat year over year at #51 but up 24 positions from #75 in May 2026, while the category leader Perpetual Harvest climbed from #4 to #1 and Root & Bloom moved from #9 to #5. This puts Blackstone Valley Cannabis at its peak rank of #51 in August 2026, whereas Simply Herb slipped from #1 to #3 as its sales fell 6.2% year over year and High Supply / Supply edged down from #3 to #4 with a 0.3% sales decline. The pattern implies that Blackstone Valley Cannabis is breaking out of the long tail with recent momentum (24-rank climb in three months) but must convert that movement into further rank gains to close the gap on incumbents advancing upward.
Notable Products
Diablo OG Distillate Cartridge (1g) posted the standout movement in August 2026 with a 36.8% month-over-month increase, climbing to rank 3, while Lemon X #2 (3.5g) slipped 6.4% but still held rank 1. Mac 1 Pre-Roll (1g) also advanced 30.5% to rank 2, whereas Coolio #18 Pre-Roll (1g) declined 5.8% at rank 6. With three Vapor Pens inside the top 8 and three Pre-Rolls in the top 10, the mix indicates a pivot toward inhalable convenience formats, suggesting Blackstone Valley Cannabis is leaning into faster-turn SKUs despite Flower anchoring the top rank and a $26,200 large-format Flower entry signaling basket-building potential.
Top Selling Cannabis Brands






Data for this report comes from real-time sales reporting by participating cannabis retailers via their point-of-sale systems, which are linked up with Headset’s business intelligence software. Headset’s data is very reliable, as it comes digitally direct from our partner retailers. However, the potential does exist for misreporting in the instance of duplicates, incorrectly classified products, inaccurate entry of products into point-of-sale systems, or even simple human error at the point of purchase. Thus, there is a slight margin of error to consider. Brands listed on this page are ranked in the top twenty within the market and product category by total retail sales volume.

