.svg)


Where to Buy
Park Jams is stocked at 57 licensed dispensaries across California, with the deepest coverage in Modesto, Sacramento, Santa Rosa, San Francisco, and Santa Cruz. Search by ZIP code or city below to find the closest one.
Market Insights Snapshot
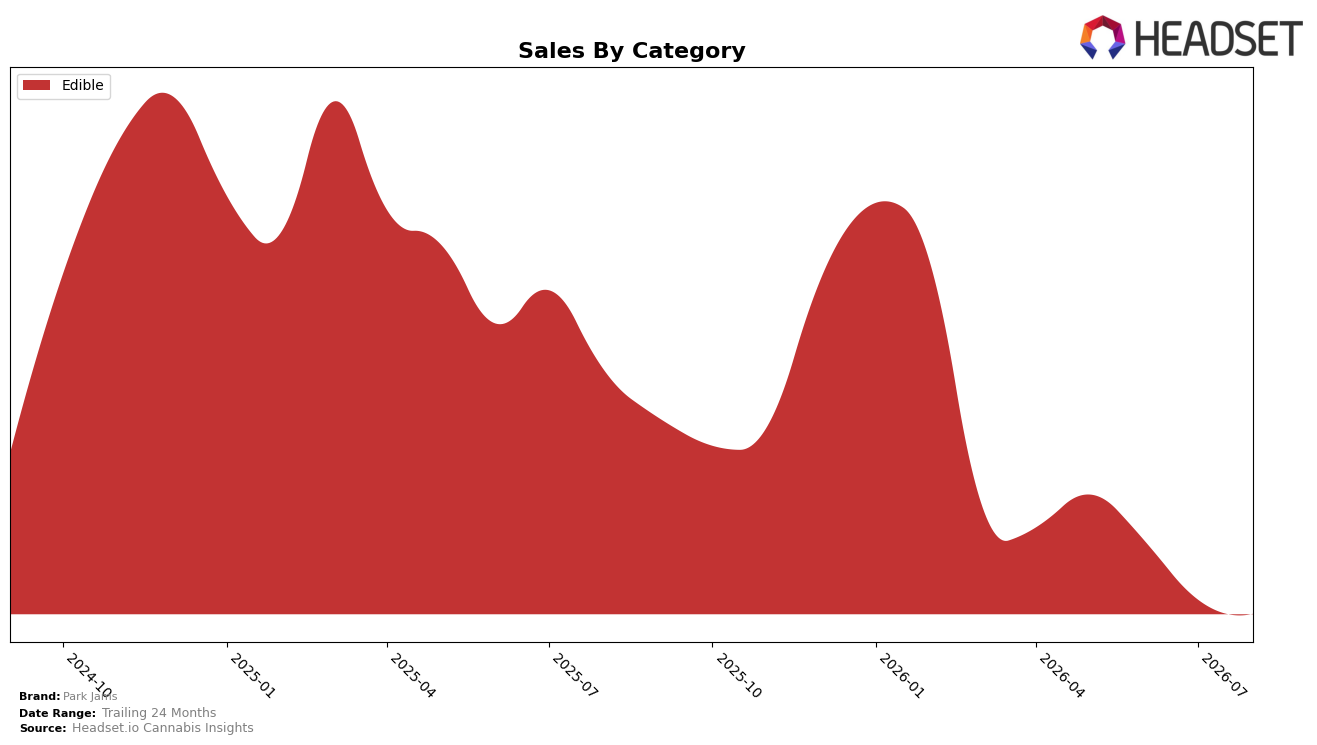
In August 2026, Park Jams operated as a single-category brand, with Edible accounting for 100.0% of sales and a -51.4% year-over-year decline paired with a -5.8% month-over-month slide; the brand’s average price dipped -1.4% YoY to $8.13, indicating price stability relative to the sharper volume contraction. Within California Edibles, the brand held rank 48, a position that aligns with the double-digit YoY contraction and modest MoM softness, implying that the category mix concentration is amplifying exposure to category-level headwinds rather than cushioning volatility.
The concentration in Edibles, combined with a -51.4% YoY sales change and placement at rank 48 in California, signals a positioning anchored in low-price offerings (average price -1.4% YoY) that are not converting into share defense. The -5.8% MoM decline alongside a stable price point suggests demand elasticity is limited at this price tier, implying that without assortment expansion or form-factor differentiation, Park Jams is likely to continue ceding rank within Edibles rather than gaining traction through price alone.
Competitive Landscape
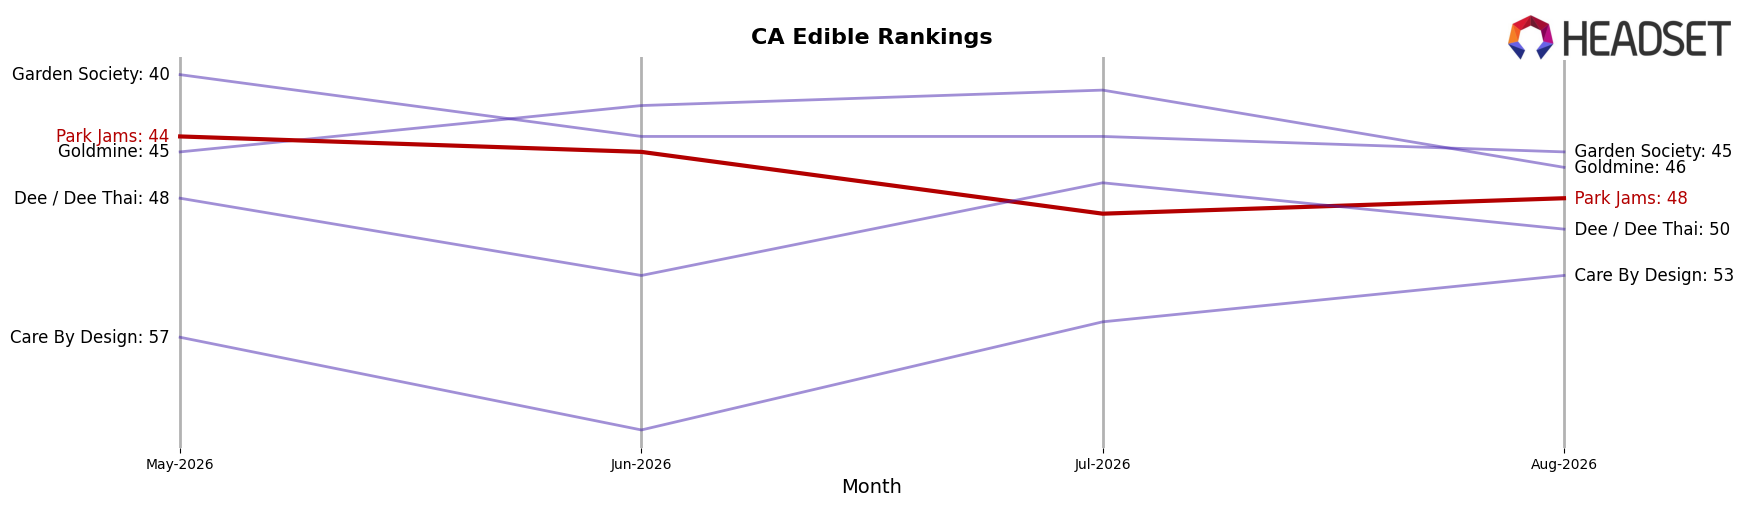
Park Jams sits at rank #48 in CA Edible in August 2026, down 10 positions from #38 in August 2025, and 4 positions below its May 2026 level of #44; relative to its peak of #33 in February 2026, the brand has slipped 15 spots over six months. In contrast, Wyld held #1 year-over-year and stayed #1 in August 2026 while posting a -3.1% YoY sales change, and Camino remained #2 with a 13.2% YoY sales increase; that stability at the top coincides with Park Jams moving from #38 to #48 while the three-month rank drifted from #44 to #48. The pattern implies Park Jams is losing relative shelf position as category leaders consolidate share, and without a reversal in rank momentum from #48 toward the February 2026 peak of #33, future distribution and visibility are likely to tighten.
Notable Products
Sour Watermelon Vegan Gummies 10-Pack (100mg) led the movement in August 2026 with a -21.4% month-over-month decline while holding rank 2, and Sour Blueberry Vegan Gummies 10-Pack (100mg) fell -31.4% at rank 9. CBG/CBD/THC 1:1:2 Pina Colada Gummies 10-Pack (50mg CBG, 50mg CBD, 100mg THC) slipped -2.5% but remained rank 1, whereas CBN/THC 1:1 Sleep Grape Gummies 10-Pack (100mg CBN, 100mg THC) rose +29.7% at rank 4. With at least eight of the top ten positioned in the Edible gummy family and mixed movements spanning -31.4% to +35.1%, the pattern implies Park Jams is consolidating around gummies while rotating focus toward functional and flavor-segmented SKUs to stabilize share at the top ranks.
Top Selling Cannabis Brands






Data for this report comes from real-time sales reporting by participating cannabis retailers via their point-of-sale systems, which are linked up with Headset’s business intelligence software. Headset’s data is very reliable, as it comes digitally direct from our partner retailers. However, the potential does exist for misreporting in the instance of duplicates, incorrectly classified products, inaccurate entry of products into point-of-sale systems, or even simple human error at the point of purchase. Thus, there is a slight margin of error to consider. Brands listed on this page are ranked in the top twenty within the market and product category by total retail sales volume.

