.svg)


Where to Buy
Crave is stocked at 45 licensed dispensaries across California, Maine, and Washington, 42 of them in California, with the deepest coverage in San Diego, Long Beach, Lake Elsinore, Los Angeles, and Riverside. Search by ZIP code or city below to find the closest one, or filter by product type if you are after a specific format.
Market Insights Snapshot
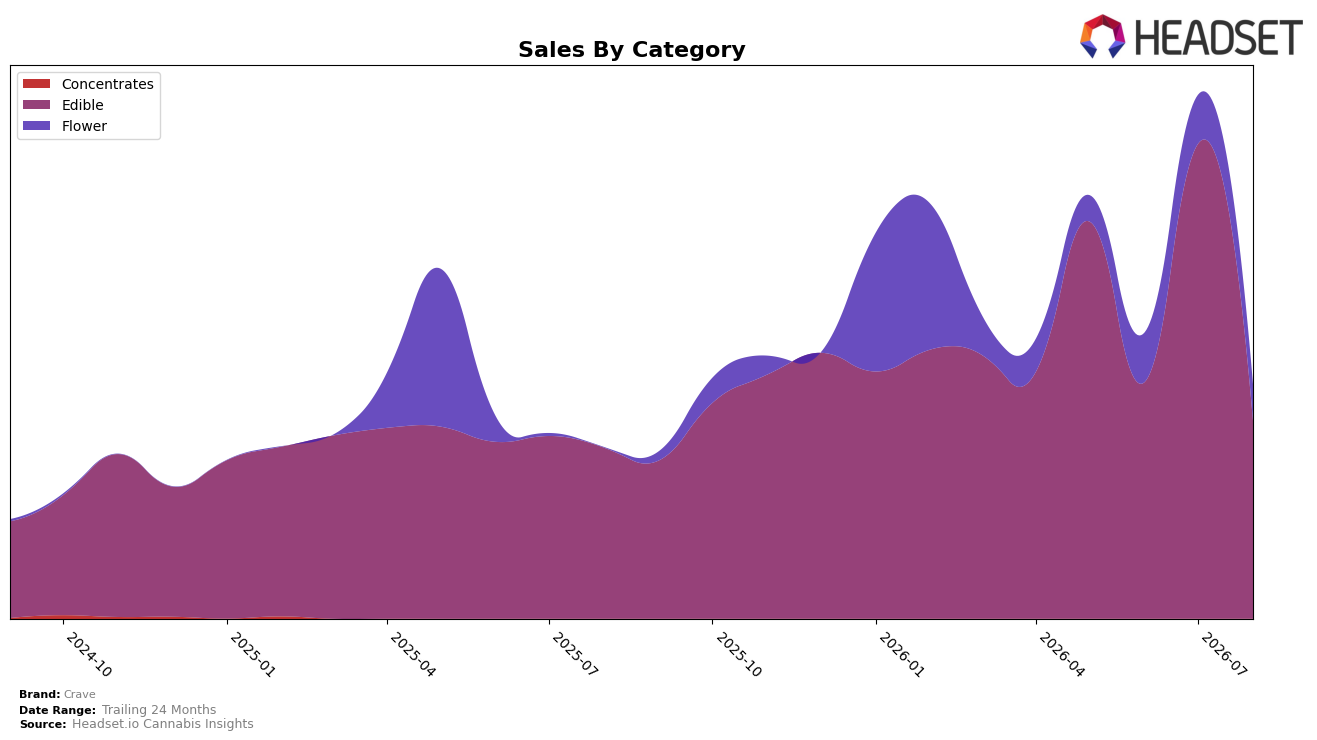
Crave’s category mix in August 2026 concentrated 84.46% of sales in Edible with a 15.28% year-over-year gain, while the same category dropped 58.54% month over month; Flower carried 15.54% share with an extreme 13,695.54% year-over-year increase and a 25.62% month-over-month decline. Within California Edible, Crave sat at rank 43, and the brand-wide average price rose 12.87% year over year to $10.74; inside the mix, Edible averaged $9.41 versus Flower at $45.85, creating a price-tier split that accompanies the share skew. The pattern implies a pivot point: despite heavy Edible reliance and a rank of 43 in the core category, the outsized year-over-year surge in Flower suggests an early-stage secondary pillar that is not yet stabilizing month to month.
The combination of an August 2026 Edible share of 84.46% and a Flower share of 15.54%, alongside a 58.54% Edible month-over-month decline and a 25.62% Flower month-over-month decline, indicates demand volatility tied to category timing rather than a uniform trend across the portfolio. With rank 43 in California Edible and a 12.87% year-over-year lift in average price against a 15.28% Edible sales increase, Crave is extracting slightly higher unit revenue while the mix shifts toward a far higher ticket in Flower ($45.85) without yet driving steady month-over-month traction. The implication is that Crave’s positioning remains anchored to value-access Edibles while testing premium-priced Flower; near-term, share defense depends on stabilizing Edible velocity, while the longer-term upside rests on converting Flower’s triple-digit year-over-year growth into sustained rank movement above 43.
Competitive Landscape
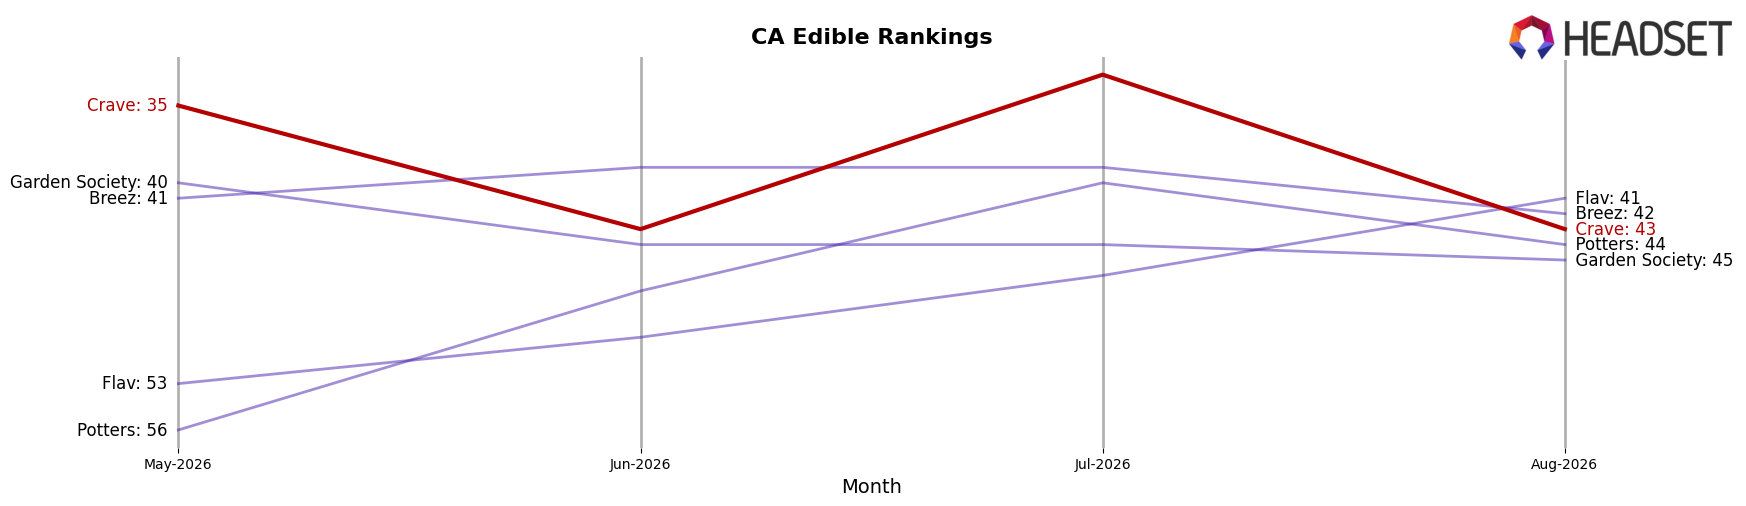
Crave sits at rank #43 in CA Edible for August 2026, improving 9 positions from #52 year over year, yet sliding 8 spots from #35 in May 2026 to #43 in August 2026; against this, July 2026 marked a peak at #33 before a 10-place comedown to the current #43. Relative positioning widened versus top players: Wyld held #1 both year over year and in August 2026 while contracting by 3.1% in sales YoY, and Kanha / Sunderstorm remained steady at #3 with a 6.8% YoY sales increase, indicating that Crave’s year-over-year gain of 9 ranks coexists with short-term rank volatility of 8 positions in three months and a lost peak from #33 to #43, which implies momentum exists on a 12-month horizon but near-term competitiveness is softening.
Notable Products
Peanut Butter Cup Milk Chocolate (100mg) posted the steepest decline at -76.7% month over month while holding rank 5, outpacing the -74.1% drop for Snickerdoodle White Chocolate Bar (100mg) at rank 9 and the -61.9% fall for Coco Crunch Chocolate Bar 10-Pack (100mg) at rank 2. Milk Chocolate Bar (100mg) led the board at rank 1 despite a -59.3% MoM slide, and Dark Chocolate Bar (100mg) followed at rank 4 with a -58.9% change, with eight of the top ten SKUs concentrated in Edibles. The CBN/THC 1:2 Sweet Dreams Chocolate Bar (50mg CBN, 100mg THC) at rank 3 fell -48.8% while Cookies & Cream Chocolate Bar (100mg) at rank 6 declined -29.0%, and the sole Flower entrant Runtz BX1 (Bulk) entered at rank 10 without a MoM baseline. The pattern implies Crave’s product mix is overexposed to Edibles volatility in August 2026, suggesting a need to balance format concentration as core chocolate SKUs compress simultaneously across price tiers, including a top item with $7,462 in sales.
Top Selling Cannabis Brands






Data for this report comes from real-time sales reporting by participating cannabis retailers via their point-of-sale systems, which are linked up with Headset’s business intelligence software. Headset’s data is very reliable, as it comes digitally direct from our partner retailers. However, the potential does exist for misreporting in the instance of duplicates, incorrectly classified products, inaccurate entry of products into point-of-sale systems, or even simple human error at the point of purchase. Thus, there is a slight margin of error to consider. Brands listed on this page are ranked in the top twenty within the market and product category by total retail sales volume.

