May-2026
Sales
Trend
6-Month
Product Count
SKUs
Avg Price
YoY Sales Change
YoY Price Change
Market Insights Snapshot
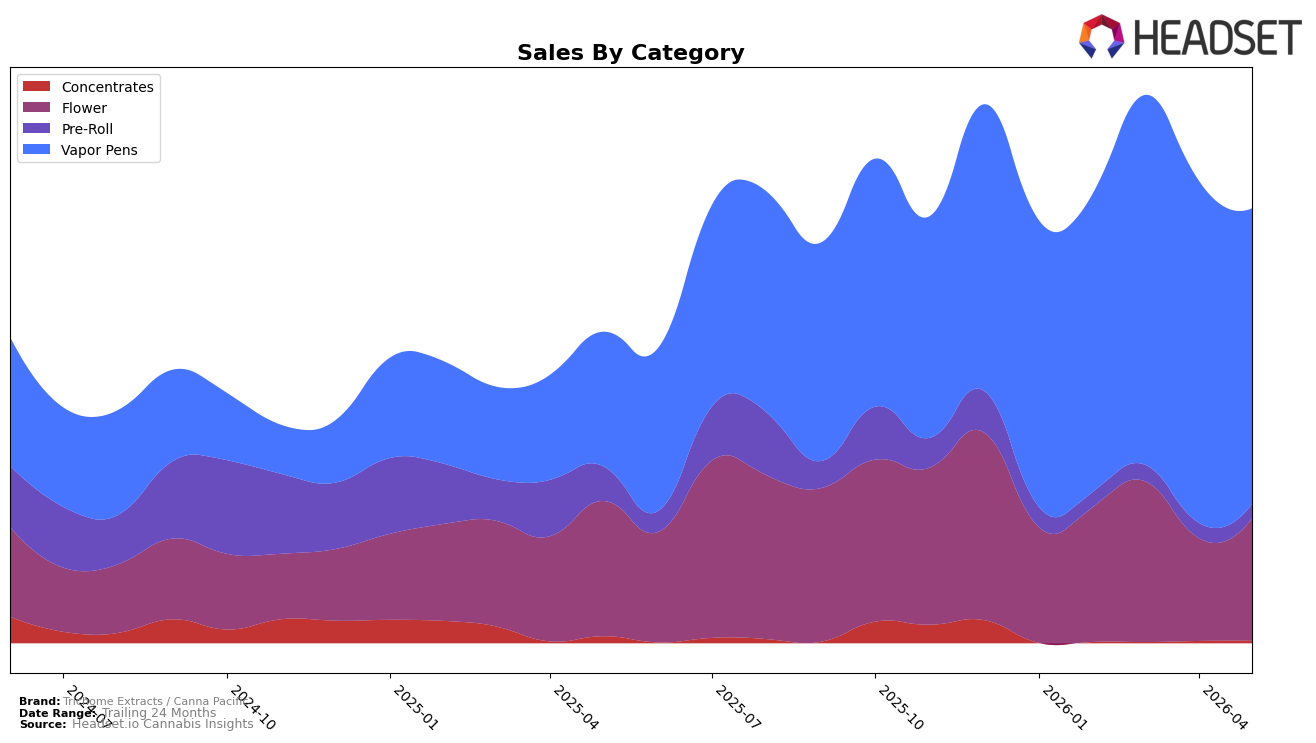
In May 2026, Vapor Pens accounted for 57.06% share with 93.77% year-over-year growth but a 12.30% month-over-month decline, while Flower held 27.35% share with a 7.43% year-over-year contraction but a 13.97% month-over-month increase; this split contrasts with Pre-Roll at 8.82% share posting a 28.14% year-over-year decline and a 1.65% month-over-month dip, and Concentrates at 6.77% share with a 10.34% year-over-year decline and a 0.42% month-over-month uptick. Average price rose 9.07% year-over-year to $20.85 as Vapor Pens averaged $24.42 and Flower $22.47, implying mix-driven pricing support alongside volume shifts. Taken together, the surge in Vapor Pens year-over-year alongside Flower’s month-over-month rebound suggests a pivot from a single-engine category to a two-category base, implying that the brand’s overall 26.88% year-over-year sales lift is increasingly dependent on balancing Vapor Pens’ scale with Flower’s short-cycle momentum.
The category rotation repositions Trichome Extracts / Canna Pacific toward higher-ticket inhalables while cushioning volatility: Vapor Pens’ 12.30% month-over-month dip against a 93.77% year-over-year rise, paired with Flower’s 13.97% month-over-month gain amid a 7.43% year-over-year decline, indicates demand hedging between discretionary vape purchases and replenishment-oriented Flower. With Pre-Roll shrinking 28.14% year-over-year and Concentrates down 10.34% year-over-year but flat month-over-month at 0.42%, the tail categories are unlikely to drive near-term share gains; instead, the current mix and a rank of 26 in Washington Vapor Pens argue for defending pen share while using Flower’s month-over-month traction to stabilize sell-through, implying a positioning that prioritizes price-tier breadth in Vapor Pens and basket-building via Flower to preserve the brand’s 57.06%/27.35% core mix.
Competitive Landscape
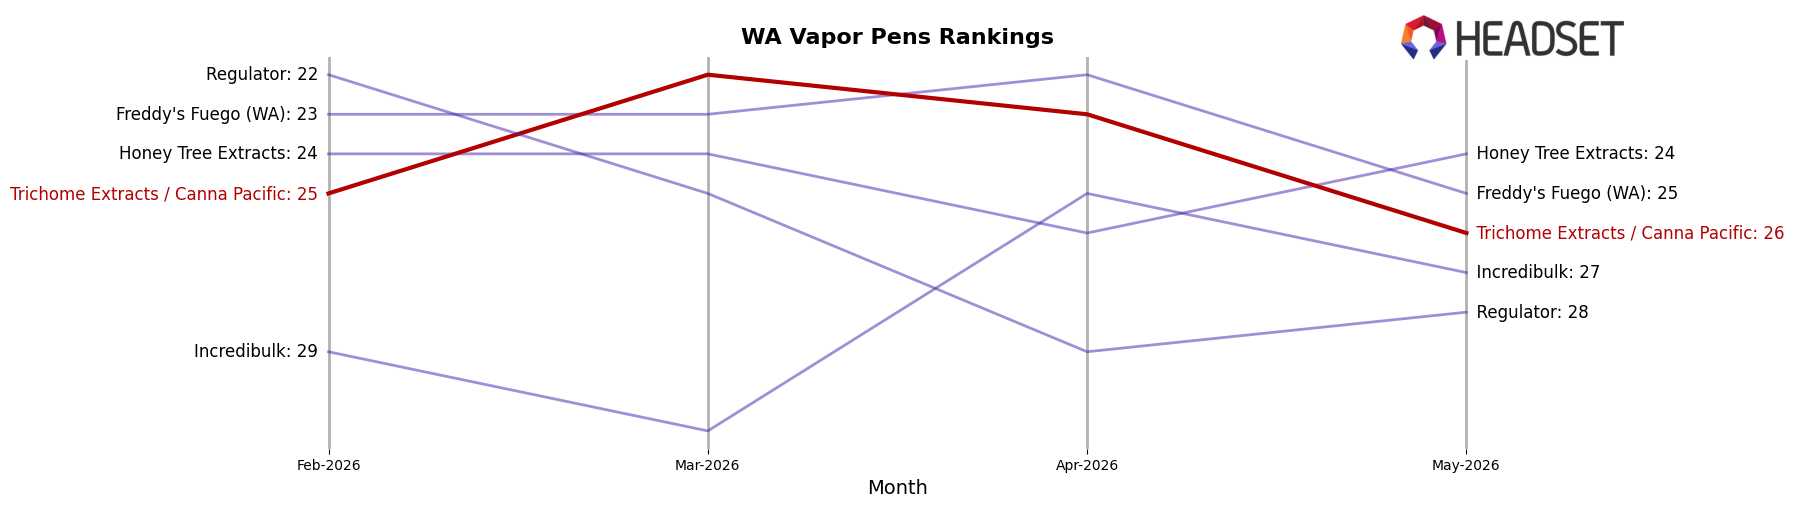
Trichome Extracts / Canna Pacific sits at rank #26 in Washington Vapor Pens in May 2026, improving 20 positions from #46 year over year, while slipping 1 spot from #25 three months ago; the brand also came off a peak of #22 in March 2026, indicating a 4-rank retreat since that high. Competitive context is mixed: Mfused is steady at #1 despite a -22.3% YoY sales change, and Full Spec climbed from #5 to #3 with +13.7% YoY growth, suggesting Trichome Extracts / Canna Pacific’s rank gains are occurring alongside leaders that are either contracting at the top or accelerating just below it. The implication is that the brand’s upward YoY trajectory from #46 to #26 reflects share capture from weakening incumbents at the top while recent slippage from #22 to #26 signals pressure from faster-rising mid-tier peers.
Notable Products
Mule Fuel Applesauce Cartridge (1g) posted the biggest movement in May 2026 with a 53.4% month-over-month rise and it sits at rank 1, indicating a sharp acceleration in Vapor Pens. Juicee J Isolate Infused Pre-Roll 2-Pack (1g) climbed 39.5% MoM and holds rank 2, while four of the top ten are Vapor Pens concentrated in ranks 1, 3, 4, 6, 7, and 9, pointing to category weight tilting toward inhalable hardware. With Peanut Butter Crasher Applesauce Cartridge (1g) at rank 3 and Mule Fuel Applesauce Disposable (1g) at rank 4, Vapor Pens control six of the top nine positions and anchor the majority of revenue at $15,329 for the lead SKU, implying Trichome Extracts / Canna Pacific is consolidating around a cartridge-led portfolio where pre-rolls play a supporting, promo-responsive role.
Top Selling Cannabis Brands
Data for this report comes from real-time sales reporting by participating cannabis retailers via their point-of-sale systems, which are linked up with Headset’s business intelligence software. Headset’s data is very reliable, as it comes digitally direct from our partner retailers. However, the potential does exist for misreporting in the instance of duplicates, incorrectly classified products, inaccurate entry of products into point-of-sale systems, or even simple human error at the point of purchase. Thus, there is a slight margin of error to consider. Brands listed on this page are ranked in the top twenty within the market and product category by total retail sales volume.

