.svg)



Market Insights Snapshot
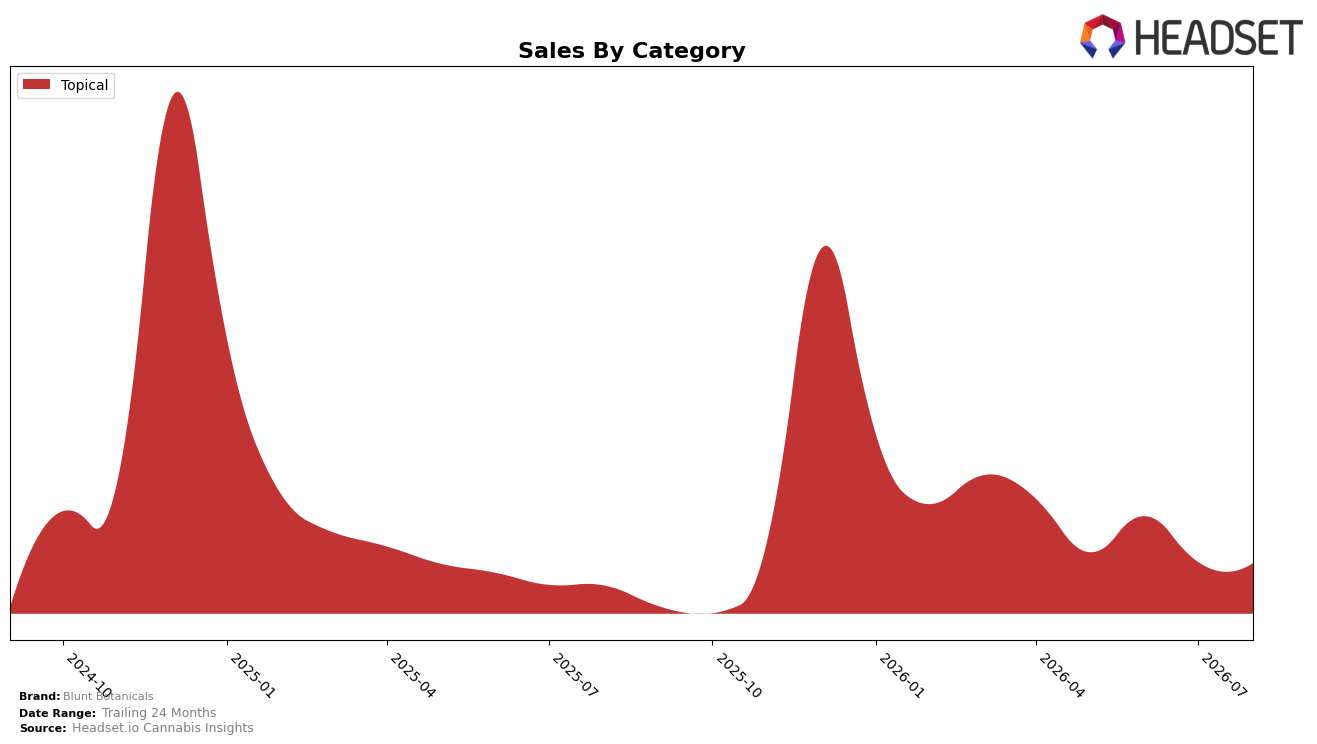
In August 2026, Blunt Botanicals operated as a single-category brand in Topical, with Topical representing 100.0% share of sales and posting 16.9% year-over-year growth alongside a -0.8% month-over-month dip. The average price declined -9.9% YoY to $14.44 while category sales grew 16.9% YoY, indicating volume expansion despite price compression, and the -0.8% MoM sales change paired with a stable 100.0% mix signals no short-term diversification or cannibalization within the portfolio. The pattern implies the brand is expanding unit throughput in Topical via price-led gains, but near-term momentum softened month to month, leaving growth more reliant on sustained elasticity than on mix shifts.
Given 100.0% concentration in Topical and a -9.9% YoY price move driving 16.9% YoY sales growth, Blunt Botanicals is competing on accessibility rather than premium positioning within Topical. The -0.8% MoM sales change in August 2026, combined with no change in category breadth, suggests limited buffer against intra-category volatility and seasonality, and the price cut raises a threshold for future margin recovery without mix diversification. The implication is that the current stance prioritizes volume-led share defense in Topical, but medium-term resilience will require either selective price normalization or incremental category entries to decouple growth from continued price concessions.
Competitive Landscape
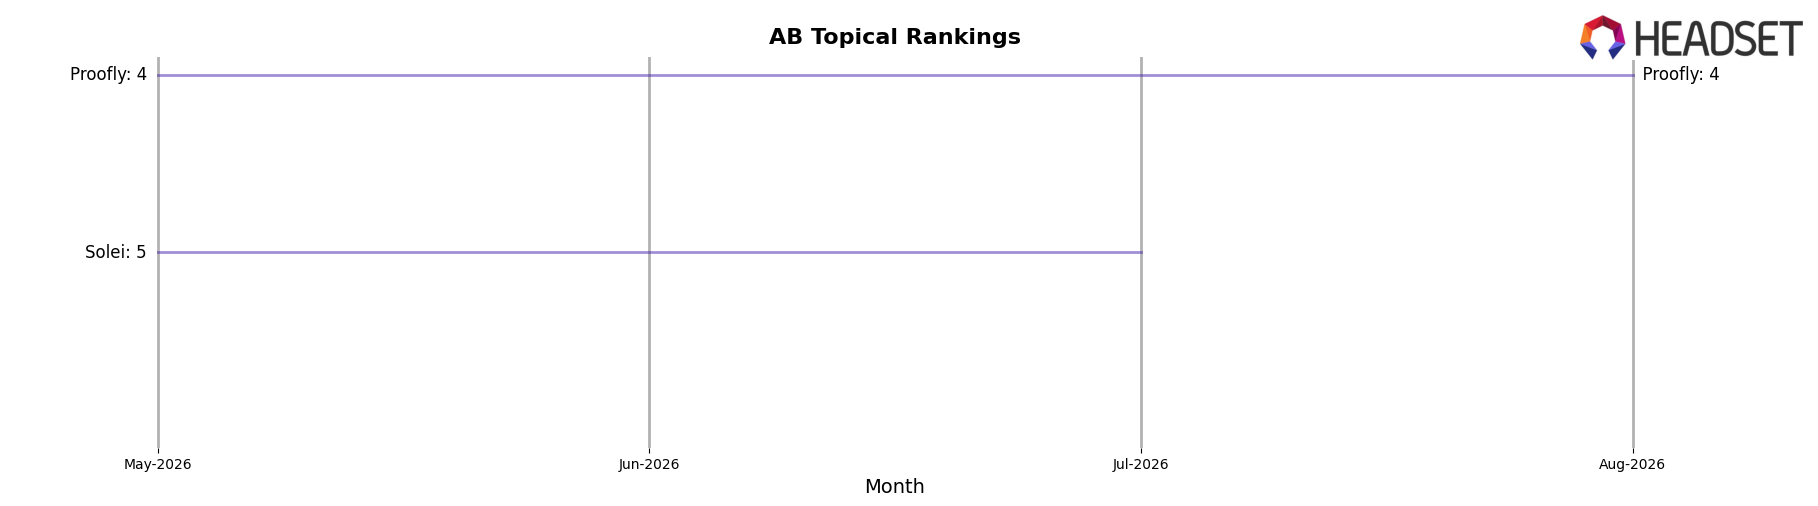
Blunt Botanicals is currently ranked #5 in AB Topical in August 2026, improving 1 position from #6 year over year, and edging up 1 rank from #6 three months ago to a peak rank of #5 in August 2026; in contrast, Wildflower climbed from #4 to #2 year over year while Stewart Farms slipped from #2 to #3 with a 46.6% YoY sales decline. Meanwhile, category leader Wildflower Canada held #1 despite a 16.7% YoY sales contraction, and Proofly fell from #3 to #4 alongside an 18.5% YoY sales decline; this mix of competitor contraction and selective ascent implies Blunt Botanicals’ steady upward rank trajectory is being enabled more by rivals’ retrenchment than by outsized share capture, signaling a window to consolidate gains before faster climbers compress the gap.
Notable Products
Jointment - CBD Alaskan TF Zero Waste Bath Bomb (50mg CBD) posted the headline move in August 2026 with a +168.3% month-over-month surge into rank 2, while CBD Pineapple Express Fizzing Bath Bomb (50mg CBD) slid -29.5% yet held rank 1, indicating share is redistributing within the lineup rather than exiting the category. Jointment - CBD/CBN Bath Salts (250mg CBD, 100mg CBN, 222g) added +27.2% and sits at rank 3, and four of the top ten are Topical SKUs concentrated in bath formats, pointing to a deepening reliance on sensory recovery use-cases over general wellness. The Pineapple Express leader still generated $4,607 alongside its decline, but the outsized Jointment gain at rank 2 suggests mix is tilting toward value or sustainability cues within bath items. This pattern implies Blunt Botanicals is pivoting toward a bath-heavy, Jointment-led portfolio where faster-turn, mission-driven variants capture incremental volume even as the flagship moderates.
Top Selling Cannabis Brands






Data for this report comes from real-time sales reporting by participating cannabis retailers via their point-of-sale systems, which are linked up with Headset’s business intelligence software. Headset’s data is very reliable, as it comes digitally direct from our partner retailers. However, the potential does exist for misreporting in the instance of duplicates, incorrectly classified products, inaccurate entry of products into point-of-sale systems, or even simple human error at the point of purchase. Thus, there is a slight margin of error to consider. Brands listed on this page are ranked in the top twenty within the market and product category by total retail sales volume.

