.svg)


Where to Buy
Clique is stocked at 46 licensed dispensaries across New Jersey, with the deepest coverage in Hoboken, Atlantic City, Elmwood Park, Jersey City, and Newton. Search by ZIP code or city below to find the closest one.
Market Insights Snapshot
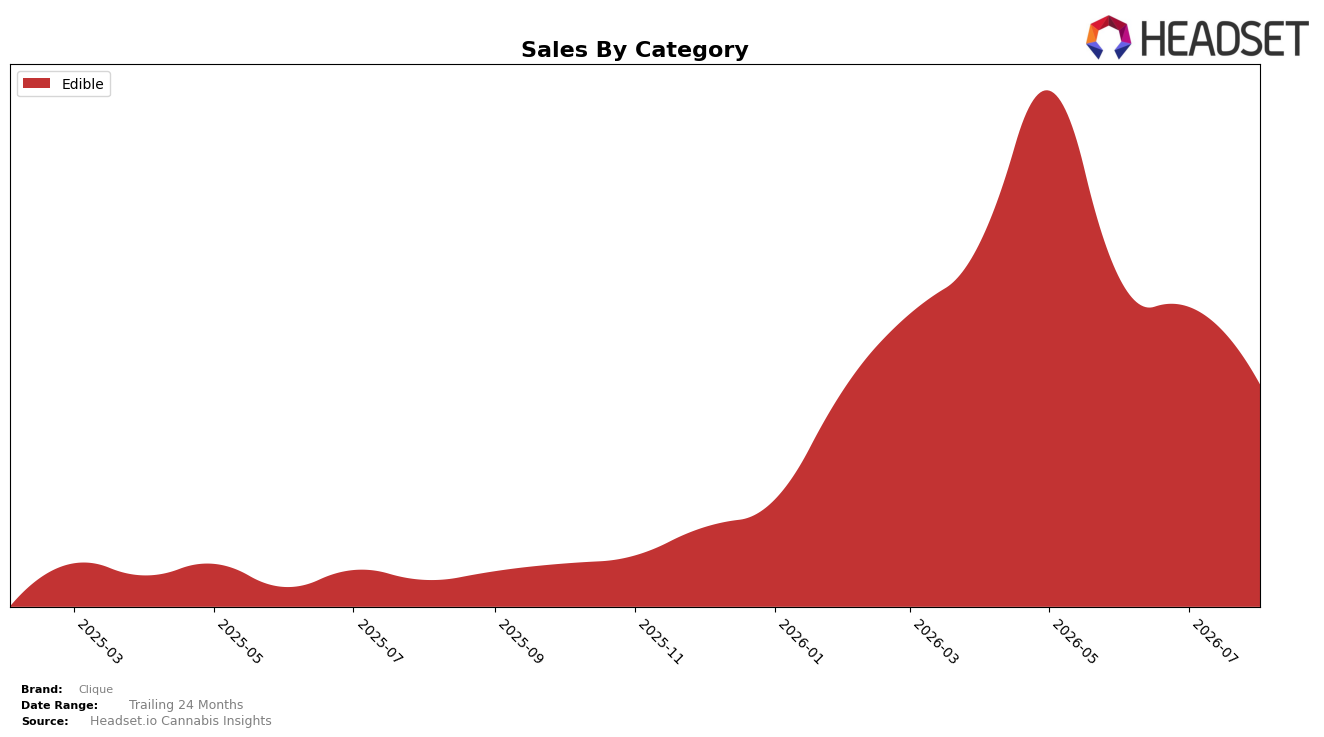
In August 2026, Clique operated as a single-category brand with Edible accounting for 100.0% of sales, pairing a 712.15% year-over-year surge with a -25.78% month-over-month pullback. The average price fell -27.41% YoY to $15.67 while category share concentration stayed at 100.0%, and the brand held rank 38 in Edible within New Jersey. The pattern implies a deliberate price-led volume strategy in Edibles that expanded annual throughput while compressing near-term momentum, leaving room to trade price for rank improvement if MoM softness persists.
The consolidation into Edibles at 100.0% share, alongside a 712.15% YoY lift but a -25.78% MoM decline, signals a positioning anchored in accessible price points rather than portfolio breadth. With rank 38 in New Jersey Edibles and a -27.41% YoY price move, the brand is competing on value and frequency more than premiumization or cross-category halo. The implication is that sustaining gains will depend on stabilizing monthly sell-through at current price architecture or incrementally trading mix toward higher-priced subsegments within Edibles to improve rank without eroding the YoY volume base.
Competitive Landscape
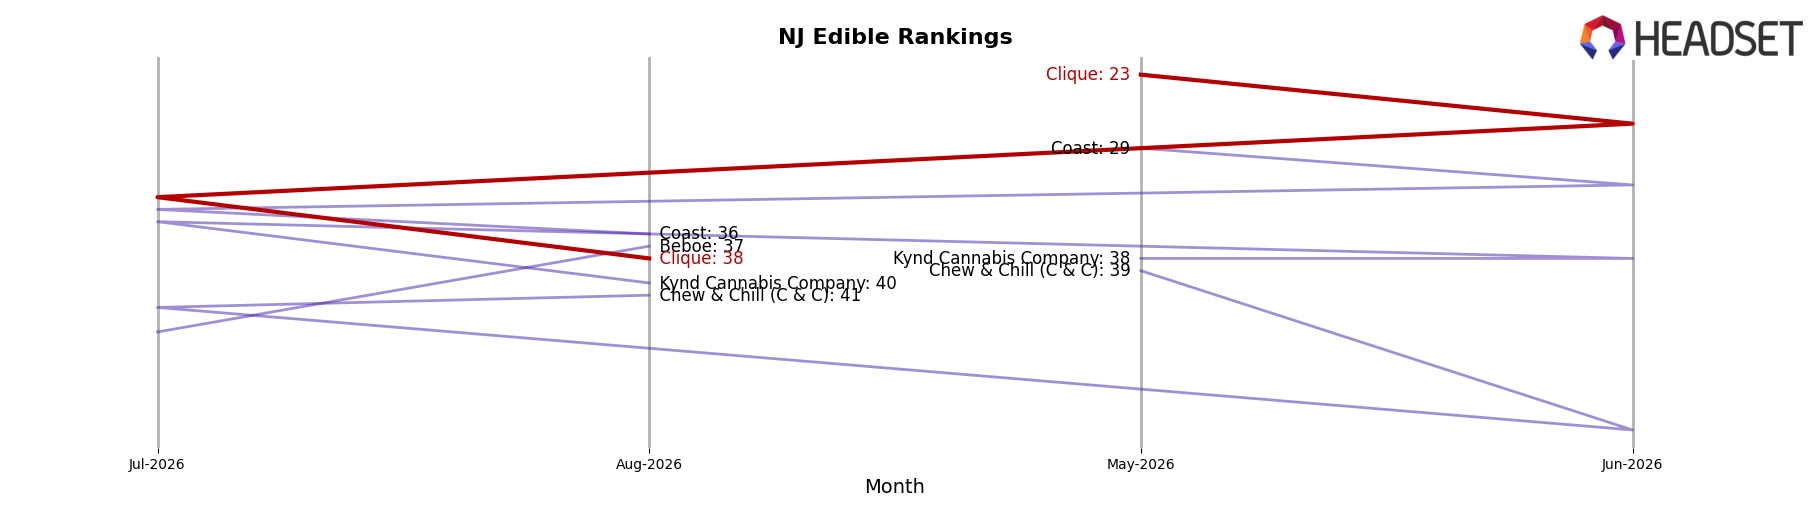
Clique sits at rank #38 in August 2026 in NJ Edible, improving 25 positions from #63 year over year, but falling 15 spots from #23 in May 2026 to #38 by August 2026; against this, Wyld held #2 year over year and in August 2026 despite a -8.6% YoY sales change, while OGEEZ climbed from #7 to #4 with +18.0% YoY sales, indicating that Clique’s spring peak at #23 in May 2026 did not convert into sustained share defense as competitors with steadier rank trajectories solidified upper-tier positions.
Notable Products
The steepest decline came from White Hibiscus RSO Gummies 10-Pack (100mg), down 75.8% MoM at rank 10, while Berry Zen Pates De Fruits Live Resin Gummies 10-Pack (100mg) fell 67.5% to rank 7. Against that backdrop, Mighties - White Hibiscus Pates De Fruits Gummies 2-Pack (100mg) rose 46.2% MoM to rank 1, outpacing a 25.2% MoM drop for Mighties - Mango Muse Live Resin Gummies 2-Pack (100mg) at rank 2. Eight of the top ten are Edible gummies, and concentration at the top split between a single rising 2-Pack leader and multiple 10- and 20-Pack formats posting declines of 13.1% to 58.7% implies the mix is consolidating toward a hero SKU while larger pack formats shed momentum.
Top Selling Cannabis Brands






Data for this report comes from real-time sales reporting by participating cannabis retailers via their point-of-sale systems, which are linked up with Headset’s business intelligence software. Headset’s data is very reliable, as it comes digitally direct from our partner retailers. However, the potential does exist for misreporting in the instance of duplicates, incorrectly classified products, inaccurate entry of products into point-of-sale systems, or even simple human error at the point of purchase. Thus, there is a slight margin of error to consider. Brands listed on this page are ranked in the top twenty within the market and product category by total retail sales volume.

