.svg)


Market Insights Snapshot
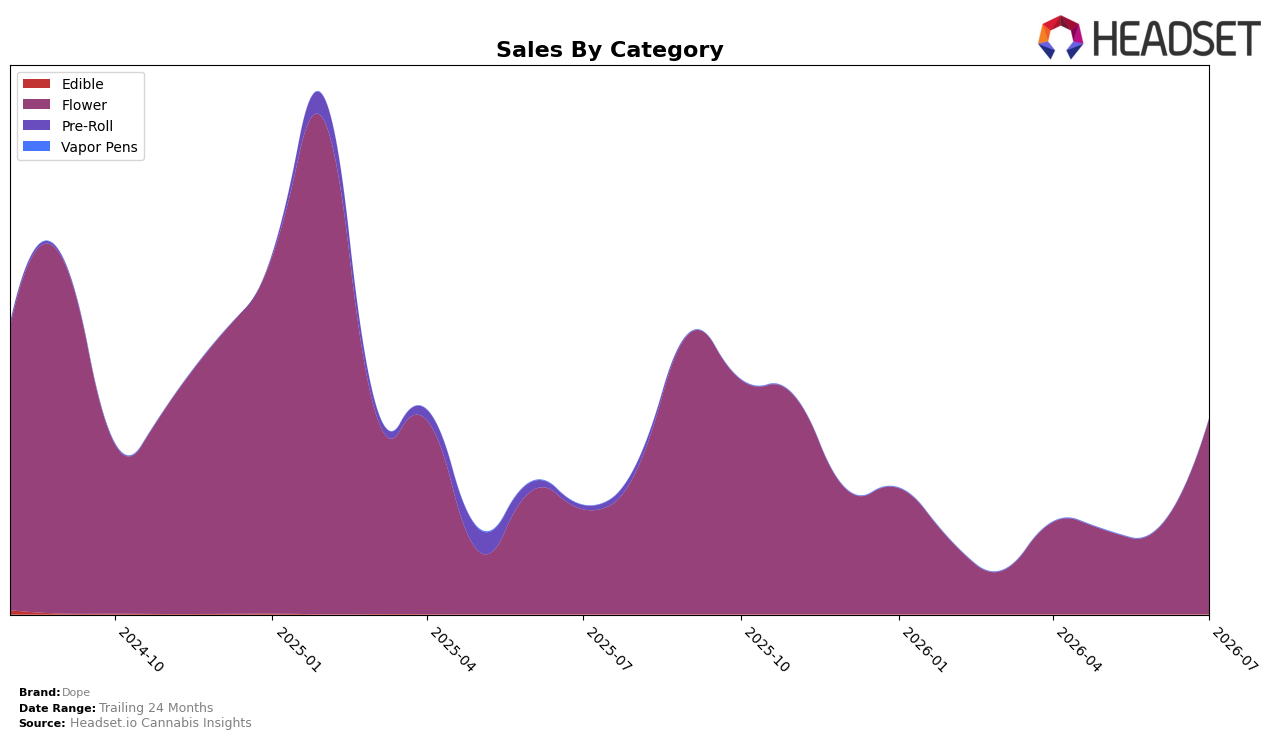
In July 2026, Dope concentrated entirely in Flower with a 100.0% category share, pairing an 86.57% year-over-year sales gain with a 130.06% month-over-month surge. Average price fell 12.81% YoY to $27.62 while total brand sales rose 79.99% YoY, implying volume expansion outpaced price compression. Within Nevada Flower, Dope sat at rank 50, indicating that despite the sharp MoM acceleration, scale remains limited within the state’s leaderboard. The pattern implies that July 2026 growth was driven by Flower-only volume recovery rather than mix diversification, positioning the brand for volatility tied to a single category.
The shift toward a single-category focus, combined with a 24-month sales decline of 49.38% and a July 2026 rank position of 50 in Nevada Flower, suggests that Dope is trading depth for breadth while relying on price-led customer acquisition after a multi-year contraction. With MoM sales up 130.06% against an 86.57% YoY increase in Flower and a 12.81% YoY price drop, the brand’s positioning hinges on converting short-cycle, promotion-sensitive volume into sustained rank gains rather than widening into adjacent categories. The implication is that maintaining July 2026 momentum will require either continued price elasticity in Flower or a re-introduction of mix to buffer single-category exposure.
Competitive Landscape
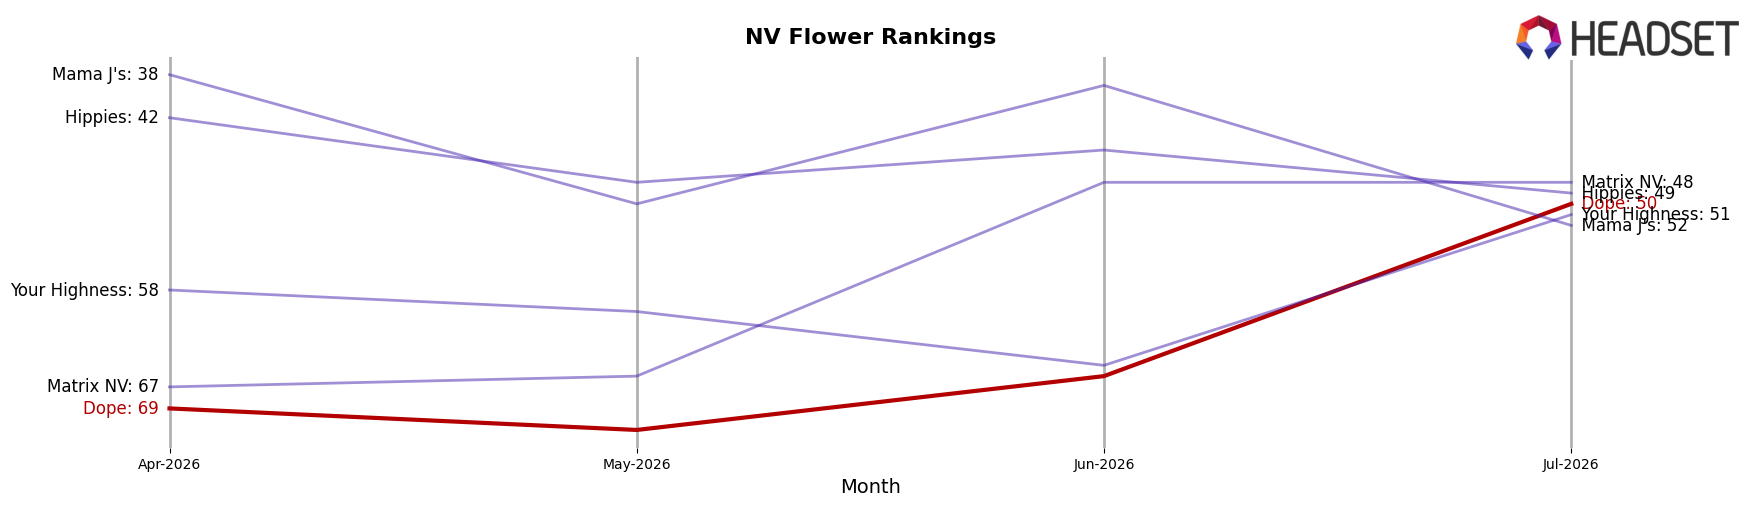
Dope sits at rank #50 in July 2026, improving 19 positions from #69 year over year, yet trailing its peak at #28 from February 2025, which marks a 22-rank slide from that high; over the last three months, the rank held flat at #69 before the July step-up to #50, indicating volatility rather than steady ascent. Competitive movement at the top was mixed: STIIIZY moved from #2 to #1 with 31.5% year-over-year sales growth, while RYTHM slipped from #1 to #2 alongside a 12.7% sales decline, and Neon Moon climbed from #10 to #3 with 52.7% growth, signaling that rank gains are concentrated among faster-growing leaders than mid-pack movers like Dope; the trajectory implies Dope’s rebound from #69 to #50 is a recovery phase that will require sustained share capture to avoid reversion toward its three-month baseline.
Notable Products
Banana Cream Cake x Jealousy (28g) delivered the standout movement in July 2026 with a 100.8% month-over-month surge that pushed it to rank 3, while Kmac (7g) fell 78.8% to rank 4. Apple Fritter x Sunset Sherbert (28g) held rank 1 as Kush Mintz x Animal Cookies (3.5g) sat at rank 2, concentrating power at the top two ranks even as GMO Cookies (14g) slid 63.9% to rank 6. With four of the top five SKUs in Flower and only one SKU exceeding $45,000, the mix points to a pivot toward large-format Flower anchored by premium flavor crosses and away from mid-pack 7g and 14g variants.
Top Selling Cannabis Brands






Data for this report comes from real-time sales reporting by participating cannabis retailers via their point-of-sale systems, which are linked up with Headset’s business intelligence software. Headset’s data is very reliable, as it comes digitally direct from our partner retailers. However, the potential does exist for misreporting in the instance of duplicates, incorrectly classified products, inaccurate entry of products into point-of-sale systems, or even simple human error at the point of purchase. Thus, there is a slight margin of error to consider. Brands listed on this page are ranked in the top twenty within the market and product category by total retail sales volume.

