.svg)


Where to Buy
Teds Budz is stocked at 44 licensed dispensaries across California, with the deepest coverage in Los Angeles, El Monte, North Hollywood, Reseda, and San Bernardino. Search by ZIP code or city below to find the closest one, or filter by product type if you are after a specific format.
Market Insights Snapshot
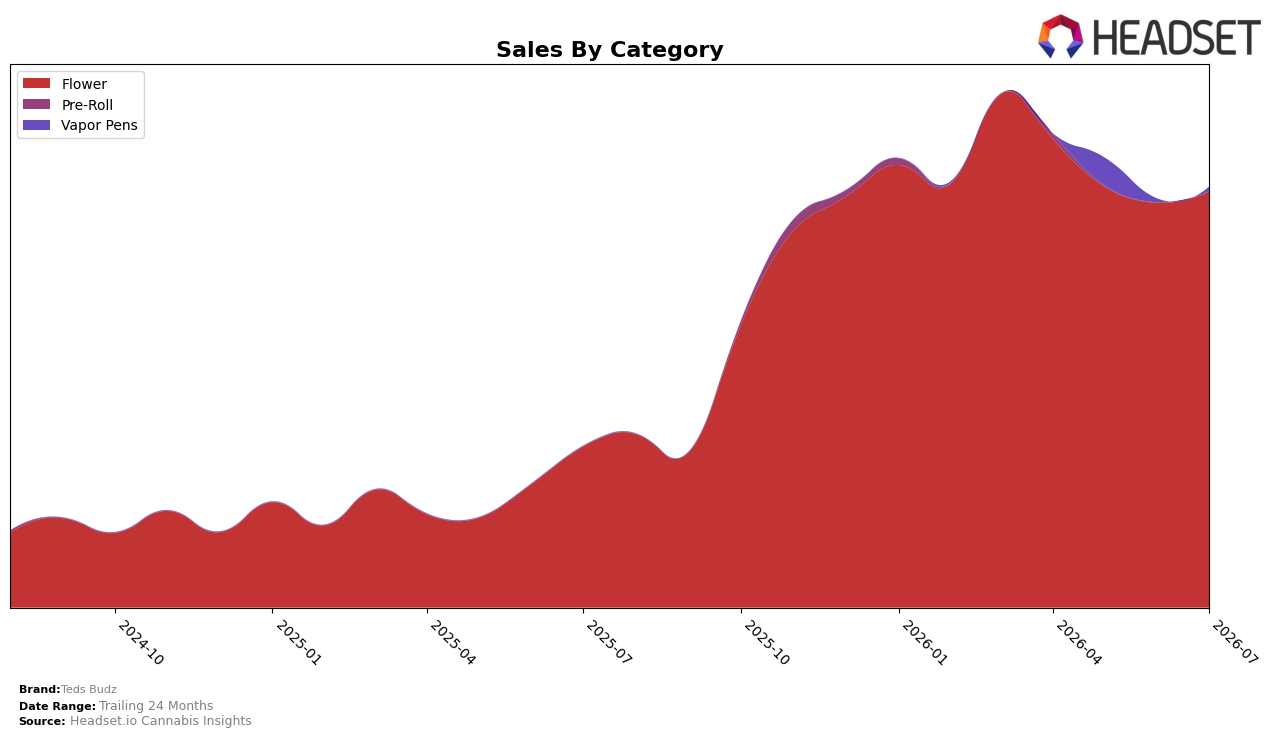
In July 2026, Teds Budz concentrated 99.03% of sales in Flower with a 2.75% month-over-month lift alongside 158.93% year-over-year growth, while Vapor Pens held 0.97% share with a 32.63% month-over-month uptick but no year-over-year baseline yet. The brand’s average price of $40.48 sat 3.54% below last year as Flower averaged $40.47 and Vapor Pens averaged $42.37, implying mix stability around Flower despite a marginal pricing retreat. With overall brand sales up 161.47% year over year and a 24‑month gain of 363.70%, the data indicate a Flower-led expansion with early Vapor Pens testing rather than a diversified pivot.
The July 2026 mix points to a positioning anchored in Flower within California, where the brand sits at rank 50 in Flower and posted a 2.75% month-over-month rise alongside a 158.93% year-over-year gain, implying depth over breadth. The 0.97% Vapor Pens share and 32.63% month-over-month growth suggest a low-risk probe rather than material portfolio balance, while the 3.54% year-over-year price decrease paired with 161.47% brand sales growth implies volume-led scale that could improve rank if sustained without further diluting price.
Competitive Landscape
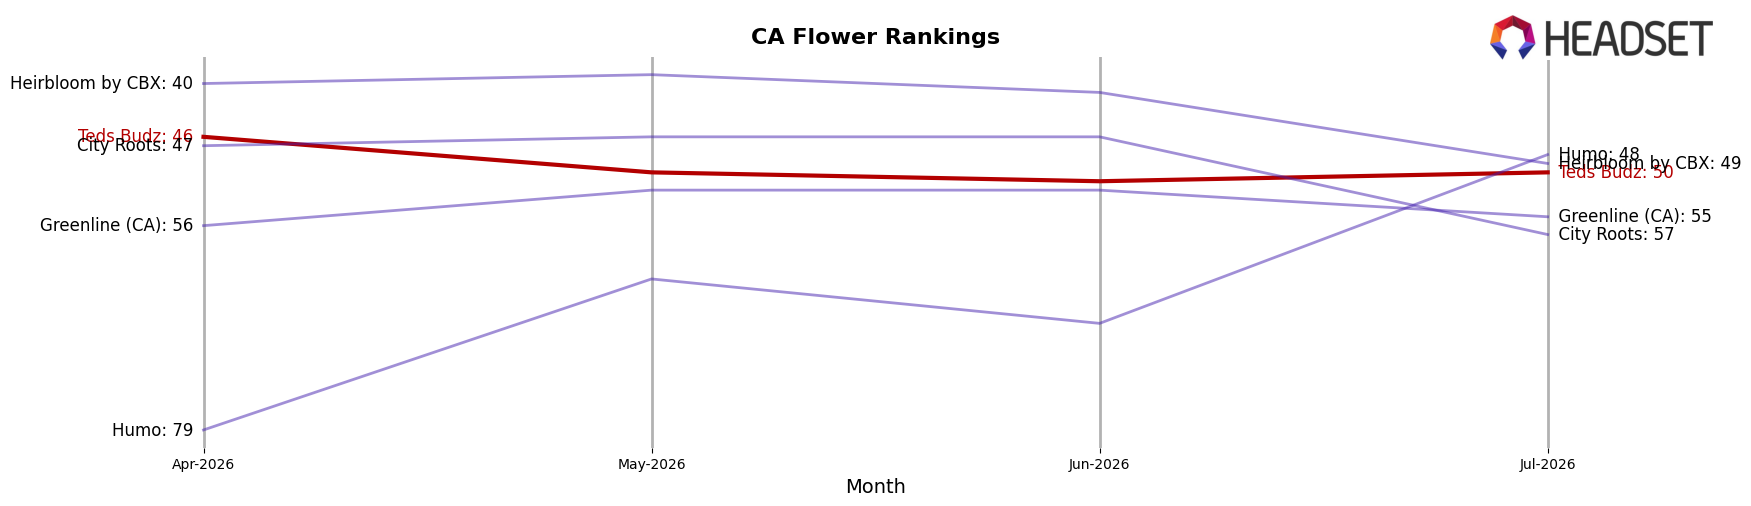
Teds Budz ranks #50 in California Flower in July 2026, improving 61 positions from #111 year over year and slipping 4 spots from #46 in April 2026; the brand also sits 11 places below its March 2026 peak at #39 and trails the category’s top end where STIIIZY moved from #2 to #1 while CAM climbed from #4 to #3, indicating that Teds Budz is rebounding on a yearly basis but losing short-term momentum relative to leaders, implying a trajectory that requires sustained monthly share gains to convert long-run recovery into durable top-40 presence.
Notable Products
Crunch Berries (3.5g) posted the steepest movement in July 2026 with a -17.1% month-over-month decline while sliding to rank 3, contrasting with Mellow Berry (3.5g) up 27.3% at rank 1. Buttered Yams (3.5g) grew 11.9% and held rank 6, and Mellow Berry (3.5g) captured the top slot against double-digit contraction in Crunch Berries, implying budget and flavor overlap is shifting share within the lineup. Eight of the top ten are Flower SKUs, concentrating demand in a single category and pointing to a portfolio that leans into a narrow form factor rather than spreading into other formats. This mix implies Teds Budz is consolidating around a few hero Flower SKUs with volatility at rank 3 signaling the need to rotate strains while protecting the rank-1 price ladder around roughly $34,402 in July 2026.
Top Selling Cannabis Brands






Data for this report comes from real-time sales reporting by participating cannabis retailers via their point-of-sale systems, which are linked up with Headset’s business intelligence software. Headset’s data is very reliable, as it comes digitally direct from our partner retailers. However, the potential does exist for misreporting in the instance of duplicates, incorrectly classified products, inaccurate entry of products into point-of-sale systems, or even simple human error at the point of purchase. Thus, there is a slight margin of error to consider. Brands listed on this page are ranked in the top twenty within the market and product category by total retail sales volume.

