.svg)


Market Insights Snapshot
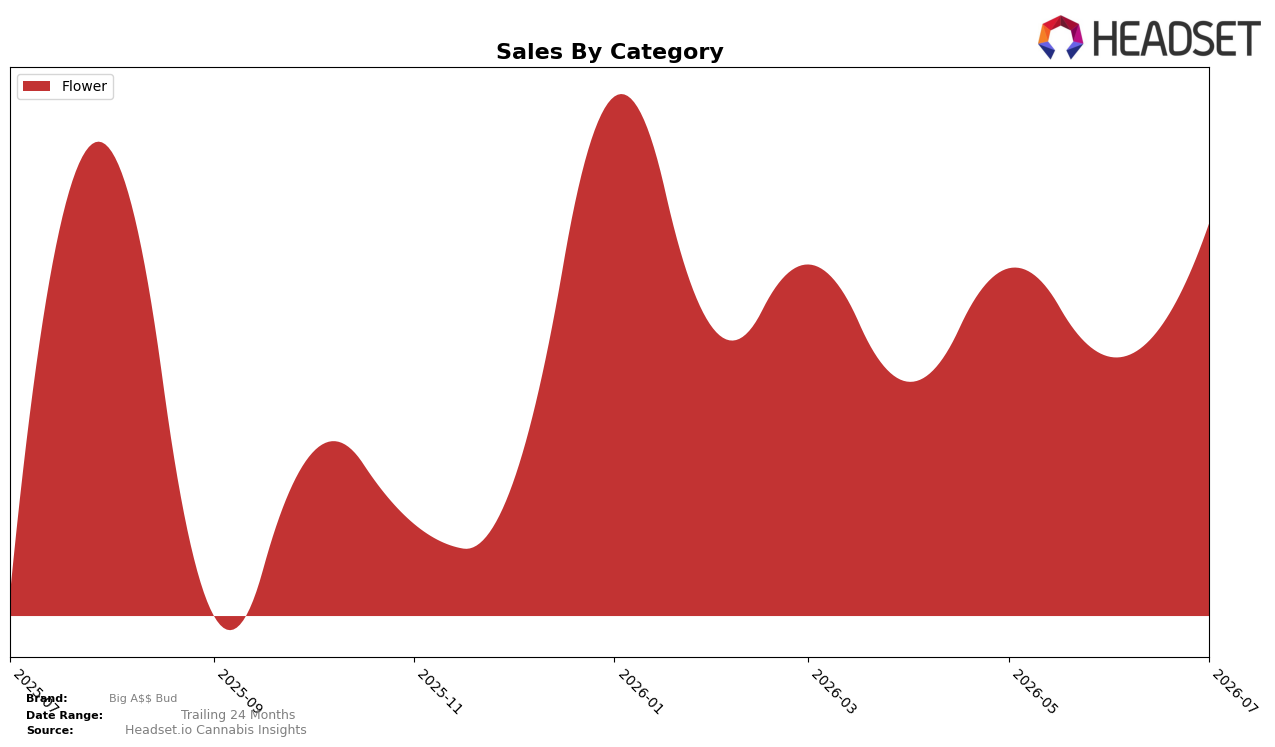
In July 2026, Big A$$ Bud operated as a single-category brand with Flower at 100.0% mix, pairing a 302.40% year-over-year sales increase with a 37.10% month-over-month lift, while average price declined 14.12% year over year to $28.36. Within Maryland Flower, the brand held rank 50, indicating that the 100.0% concentration and the 37.10% MoM growth likely came from deeper penetration or velocity rather than assortment breadth, and the 14.12% price compression suggests a volume-led expansion that trades off ticket size for share capture.
The combination of a 302.40% YoY surge alongside a 14.12% YoY price drop implies a deliberate price-to-volume strategy aimed at moving up from rank 50 by prioritizing unit throughput over premium positioning. With a 100.0% Flower reliance and a 37.10% MoM upswing, the brand is positioned as a single-category volume player in Maryland, which implies near-term gains hinge on sustaining lower price points or adding formats that convert Flower traffic without diluting the core, rather than relying on mix diversification today.
Competitive Landscape
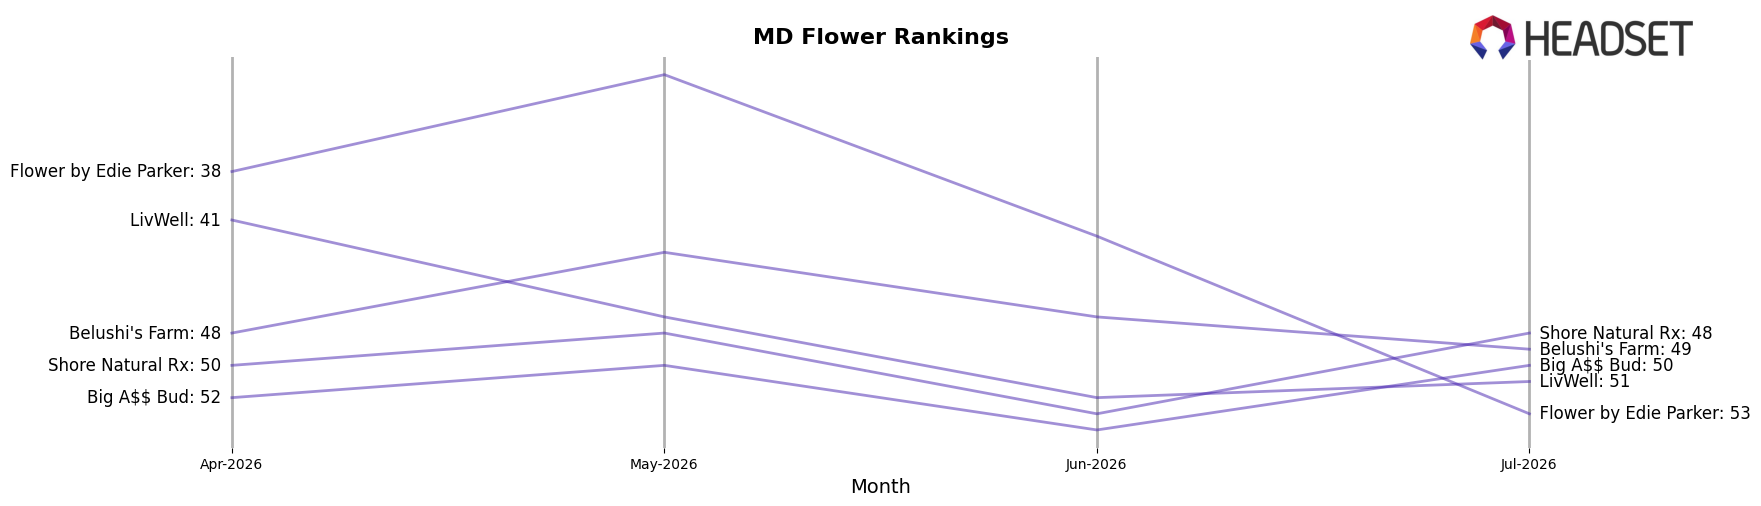
Big A$$ Bud sits at rank #50 in MD Flower for July 2026, improving 7 positions from #57 year over year, though it slipped 2 spots from #52 in April 2026 and remains below its peak of #45 from August 2025; meanwhile, SunMed held #1 with a 7.8% YoY sales increase and RYTHM advanced from #3 to #2 on 47.9% YoY growth, indicating that Big A$$ Bud’s modest rank climb is occurring while top rivals consolidate higher positions. The mix of a year-over-year rise of 7 ranks alongside a recent quarter-over-quarter dip of 2 ranks signals partial recovery without sustained momentum, implying that maintaining upward trajectory will require faster share capture than competitors ascending the leaderboard.
Notable Products
Watermelon Zum Zum (3.5g) posted the largest month-over-month surge at +101.3% and climbed into the top 10 at rank 9, while Sour Jack (3.5g) fell -22.3% to rank 3 and Sour Dubble (3.5g) declined -18.6% at rank 2. Old Money (3.5g) jumped +91.6% to rank 6 and Mango Mintality (3.5g) rose +66.8% to rank 4, whereas Blueberry Cruffin (3.5g) held rank 1 with an unreported MoM rate and $4,030 in July 2026 sales. All ten top products are Flower SKUs, indicating a concentrated lineup where recent gains are driven by newer or revitalized strains offsetting declines among established leaders, implying Big A$$ Bud is shifting mix toward faster-moving flower innovations rather than diversifying formats.
Top Selling Cannabis Brands






Data for this report comes from real-time sales reporting by participating cannabis retailers via their point-of-sale systems, which are linked up with Headset’s business intelligence software. Headset’s data is very reliable, as it comes digitally direct from our partner retailers. However, the potential does exist for misreporting in the instance of duplicates, incorrectly classified products, inaccurate entry of products into point-of-sale systems, or even simple human error at the point of purchase. Thus, there is a slight margin of error to consider. Brands listed on this page are ranked in the top twenty within the market and product category by total retail sales volume.

