.svg)

Aug-2026
Sales
Trend
6-Month
Product Count
SKUs
Avg Price
YoY Sales Change
YoY Price Change


Where to Buy
Cannaroos is stocked at 40 licensed dispensaries across Washington, with the deepest coverage in Lacey, Olympia, Seattle, Everett, and Lynnwood. Search by ZIP code or city below to find the closest one.
Market Insights Snapshot
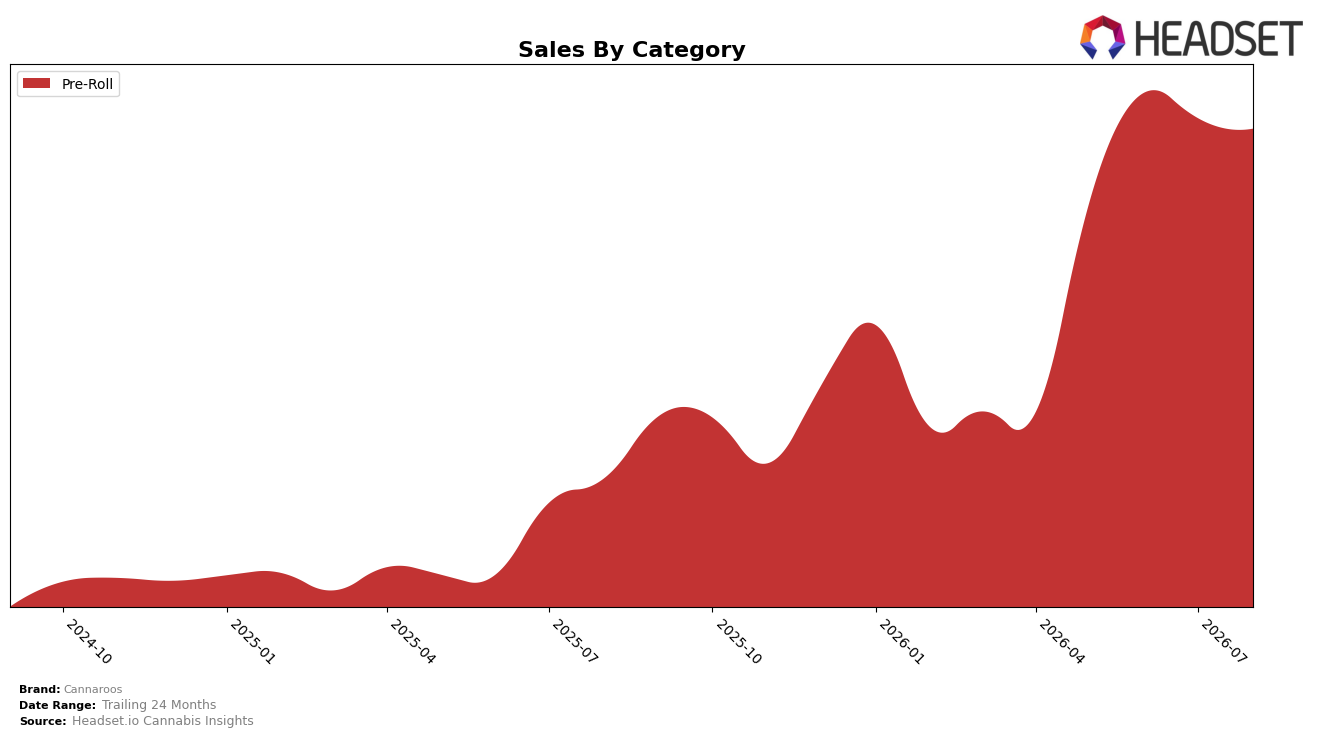
In August 2026, Cannaroos operated as a single-category brand with Pre-Roll accounting for 100.0% of sales, while year-over-year sales in that category rose 209.4% and month-over-month dipped 2.0%. Average price increased 6.7% year-over-year alongside a 2.0% month-over-month volume drag implied by the sales decline, indicating price was not the near-term lever. The brand sat at rank 49 within Pre-Roll in Washington, and the combination of a 209.4% yearly gain with a 1-rank static context (49) implies momentum has not yet converted into material rank mobility. The pattern implies a concentrated bet on Pre-Roll is fueling annual scale, but the slight monthly pullback and a rank of 49 point to a need for either mix expansion or price-pack changes to translate growth into laddering up the competitive set.
The all-in Pre-Roll focus (100.0% mix) paired with a 209.4% annual surge and a 2.0% monthly step-down positions Cannaroos as a niche penetrator rather than a diversified portfolio player, with rank 49 in Washington signaling mid-to-lower tier visibility. With average price up 6.7% year-over-year and sales down 2.0% month-over-month, elasticity risk is localized to recent weeks, suggesting pack-size architecture or promotional cadence could convert the yearly demand into steadier monthly rank gains. The implication is that sustaining share growth in Pre-Roll at rank 49 will likely require either deepening frequency at the current price band or selectively broadening beyond Pre-Roll to mitigate monthly volatility while preserving the 209.4% year-over-year momentum.
Competitive Landscape
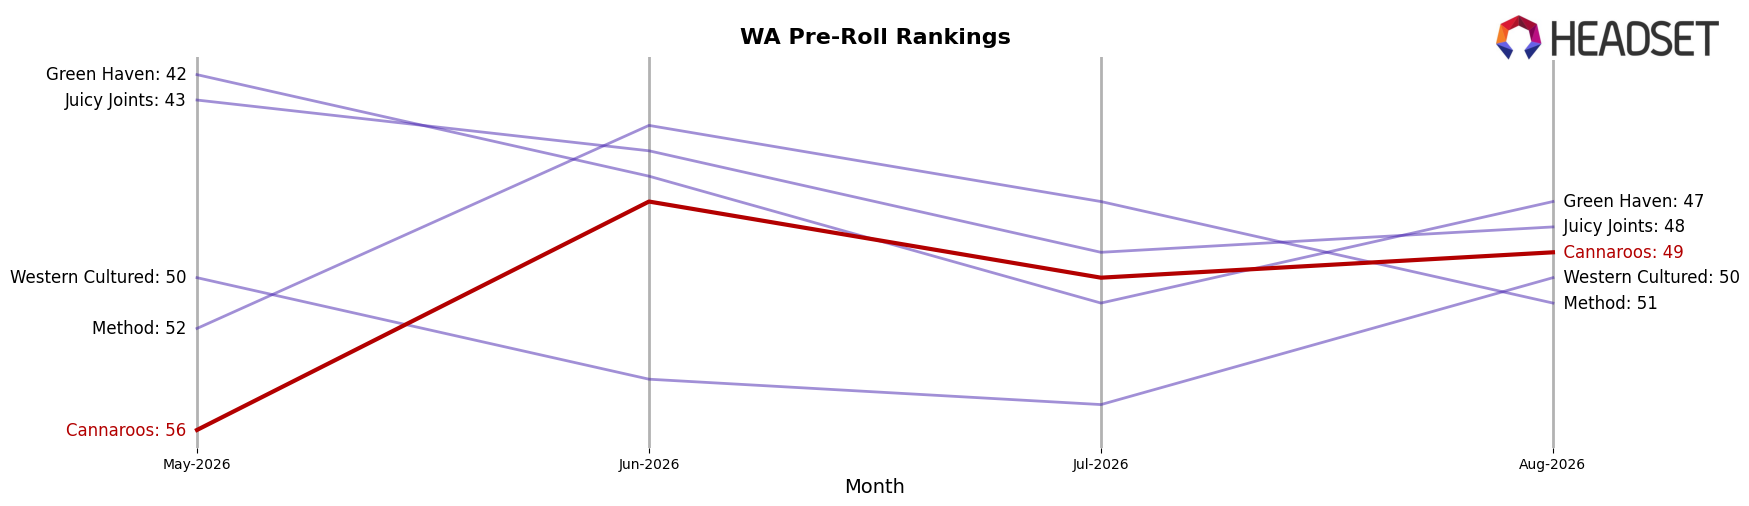
Cannaroos sits at rank #49 in WA Pre-Roll for August 2026, improving 77 spots from #126 year over year, and tightening from #56 three months ago while still two places off its peak of #47 in June 2026; in contrast, Ooowee held #1 both this year and last while growing sales 53.14%, and Lifted Cannabis Co advanced from #6 to #4 with 28.84% sales growth, indicating Cannaroos is climbing from the lower tier but not yet matching the pace-setting stability or upward mobility of the leaders, which implies a trajectory toward mid-tier viability if conversion from intermittent peaks to sustained rank gains continues.
Notable Products
Lime Light Diamond Infused Pre-Roll 10-Pack (5g) posted the steepest decline at -36.7% month over month while holding rank 9, and Off Gas Diamond Infused Pre-Roll 10-Pack (5g) fell -15.2% at rank 8. In contrast, Pure Kush Diamond Infused Pre-Roll 10-Pack (5g) rose 43.7% month over month to rank 1 with $6,015 in August 2026, and Fritter Glitter Diamond Infused Pre-Roll 10-Pack (5g) slid -14.7% at rank 7. With ten of the top ten SKUs concentrated in Pre-Roll formats and rank shifts concentrated at both the top (rank 1) and mid-pack (ranks 7–9), the pattern implies Cannaroos is consolidating around a single format while pruning or cycling strains, increasing volatility within the Pre-Roll lineup to favor breakout winners.
Top Selling Cannabis Brands






Data for this report comes from real-time sales reporting by participating cannabis retailers via their point-of-sale systems, which are linked up with Headset’s business intelligence software. Headset’s data is very reliable, as it comes digitally direct from our partner retailers. However, the potential does exist for misreporting in the instance of duplicates, incorrectly classified products, inaccurate entry of products into point-of-sale systems, or even simple human error at the point of purchase. Thus, there is a slight margin of error to consider. Brands listed on this page are ranked in the top twenty within the market and product category by total retail sales volume.

