.svg)


Where to Buy
ChocLit is stocked at 13 licensed dispensaries across New York, with the deepest coverage in Farmingdale, New York, Airmont, Albany, and Binghamton. Search by ZIP code or city below to find the closest one.
Market Insights Snapshot
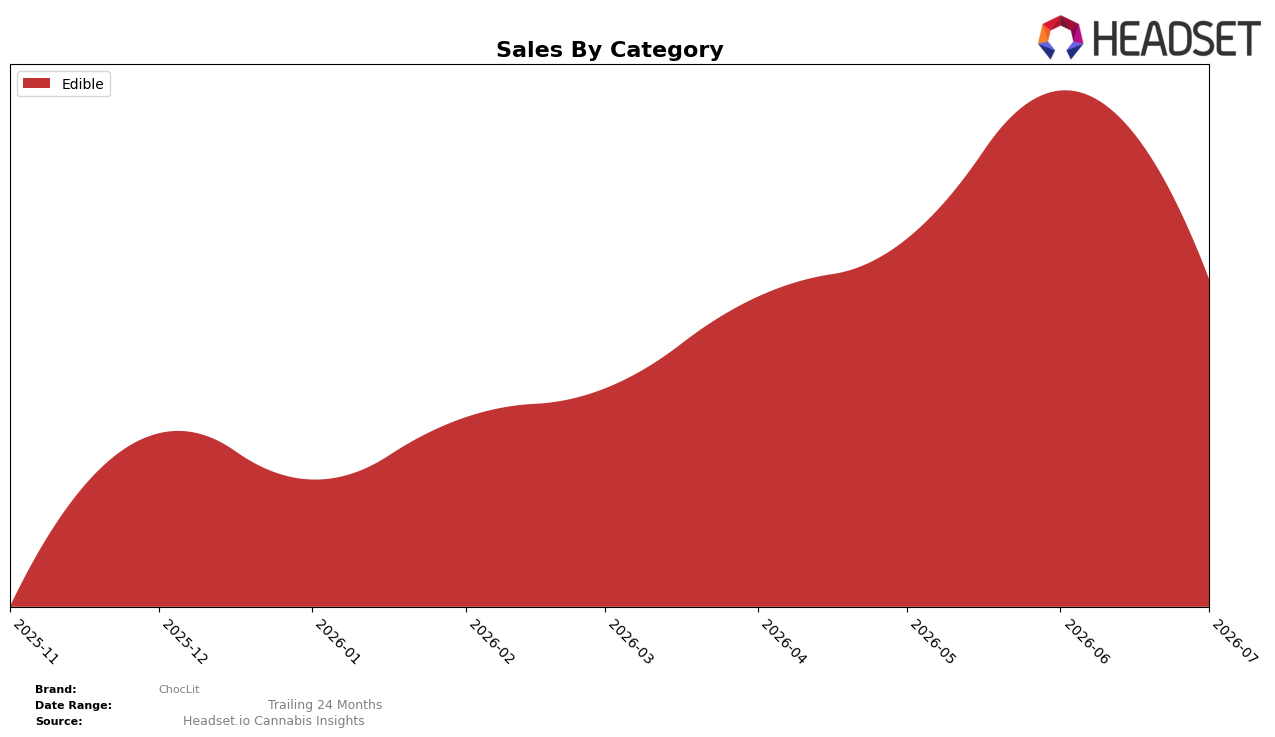
In July 2026, ChocLit operated as a single-category brand with Edible at 100.0% category mix share and a month-over-month decline of 33.8%, while average price held at $9.68. Within New York Edible, the brand sat at rank 40, indicating a mid-pack placement that slipped versus month-ago momentum and concentrated entirely in one format; the pairing of a 100.0% share in Edible and a 33.8% MoM contraction implies volume loss rather than portfolio rebalancing.
The combination of a 100.0% single-category footprint and a rank of 40 in New York Edible, alongside a 33.8% month-over-month retreat, implies limited insulation from seasonal and promotional swings and a need to trade for rank gains within Edible rather than diversify. With average price at $9.68 and no offset from other categories, the pattern points to a positioning that is vulnerable to price-value dynamics in Edible alone and would require either price-pack architecture shifts or depth in subtypes to reverse a 33.8% MoM pullback while climbing from rank 40.
Competitive Landscape
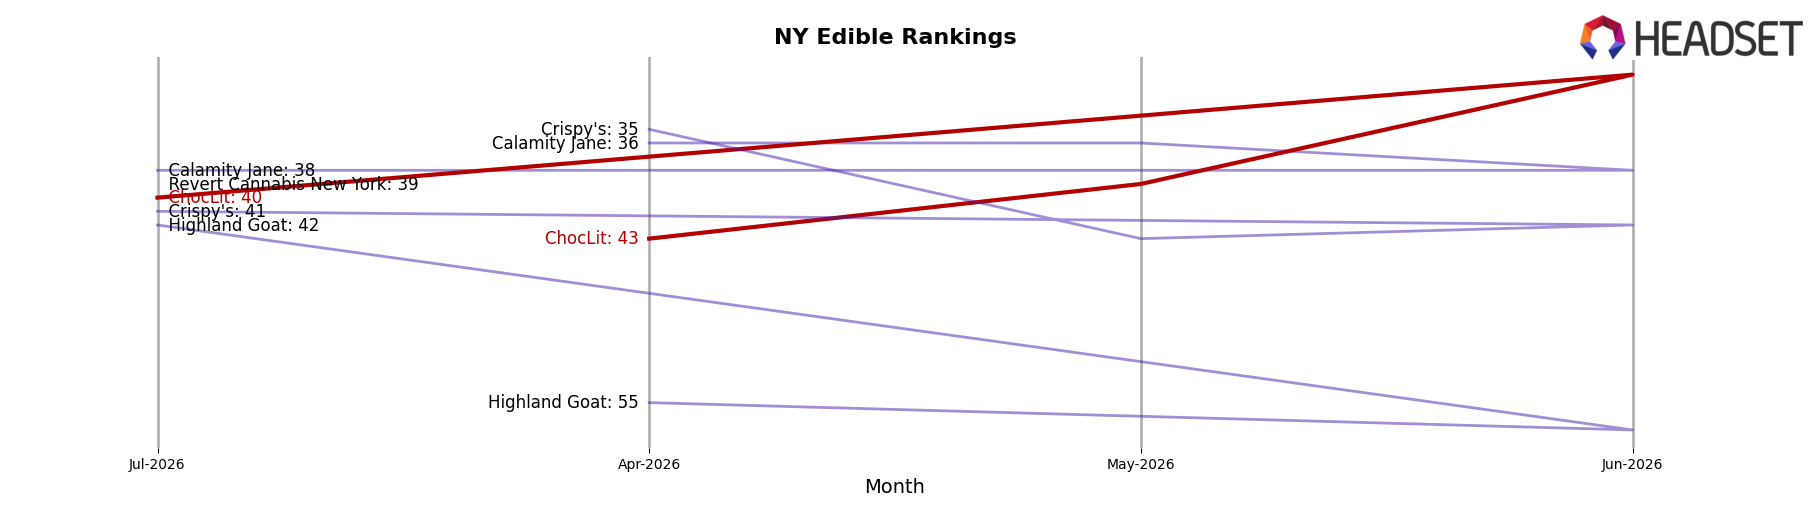
ChocLit sits at #40 in New York Edible for July 2026, slipping 3 ranks from #43 in April 2026 but down from its peak of #31 in June 2026; the month-to-month move from #31 to #40 indicates a 9-place drop, while the quarter-to-date change from #43 to #40 is a 3-place gain. Against the leaders, Camino is steady at #1 after rising two places year over year, and Off Hours holds #2 while declining from #1 year over year with a -10.48% YoY sales change, signaling that ChocLit’s near-term slide is occurring as the top tier concentrates and mid-tier mobility tightens; the pattern implies ChocLit is oscillating around the low-40s with limited carry-through from its June 2026 peak, so sustaining gains will require converting brief rank spikes into durable month-over-month advances.
Notable Products
Crispy Rice Crunchies Milk Chocolate Bar 10-Pack (100mg) posted the steepest decline at -69.3% month over month and slid to rank 2, while English Toffee Bits Milk Chocolate Bar 10-Pack (100mg) fell -61.1% and held rank 3; meanwhile, Peanut Butter Filling Milk Chocolate Bar 10-Pack (100mg) inched up +4.9% to rank 1 with $32,325 in July 2026. All three top-3 SKUs are Edible bars, concentrating 100% of the top ten within a single format, and the gap between a modest +4.9% gain at rank 1 and two >60% declines at ranks 2–3 signals a bar portfolio increasingly dependent on one hero SKU and at risk of volatility if that lead softens.
Top Selling Cannabis Brands






Data for this report comes from real-time sales reporting by participating cannabis retailers via their point-of-sale systems, which are linked up with Headset’s business intelligence software. Headset’s data is very reliable, as it comes digitally direct from our partner retailers. However, the potential does exist for misreporting in the instance of duplicates, incorrectly classified products, inaccurate entry of products into point-of-sale systems, or even simple human error at the point of purchase. Thus, there is a slight margin of error to consider. Brands listed on this page are ranked in the top twenty within the market and product category by total retail sales volume.

