.svg)


Where to Buy
HI-YAH! is stocked at 41 licensed dispensaries across Washington, with the deepest coverage in Tacoma, Seattle, Vancouver, Everett, and Snohomish. Search by ZIP code or city below to find the closest one.
Market Insights Snapshot
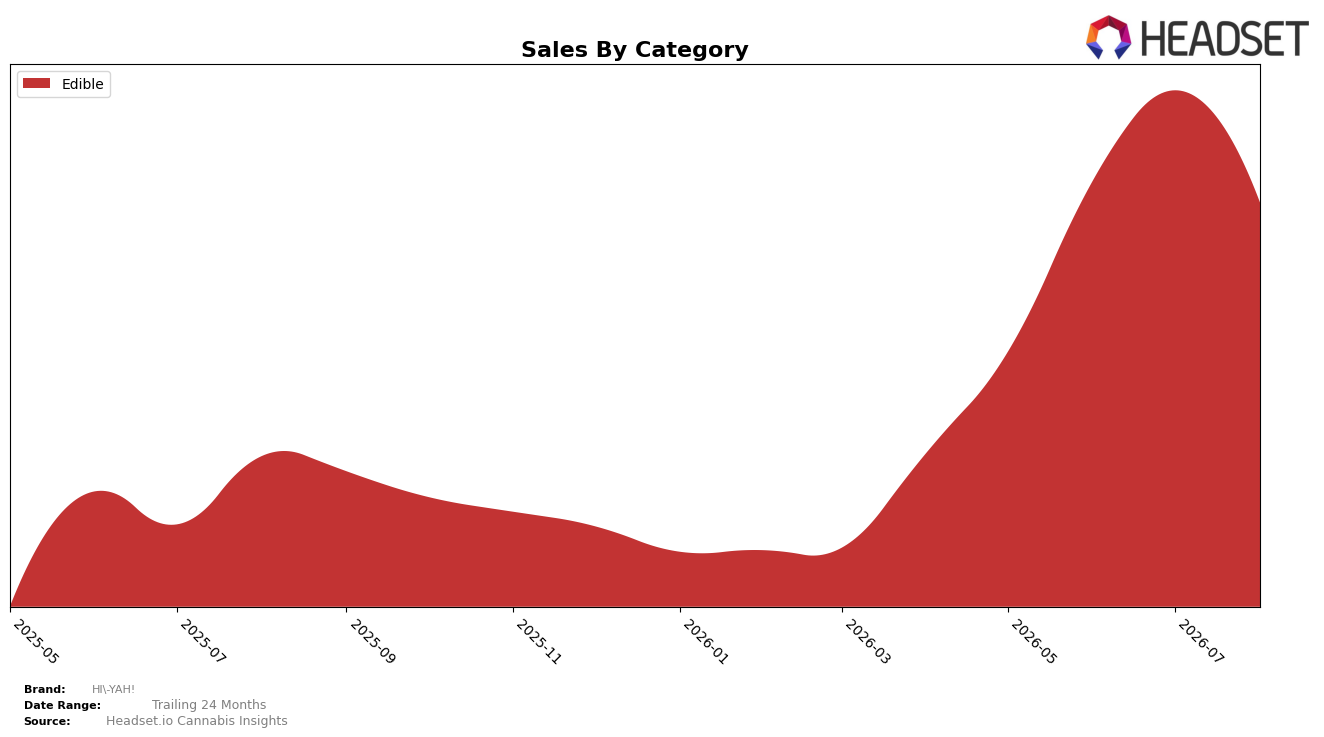
HI-YAH!'s category mix in August 2026 was fully concentrated in Edible at 100.0% share, with year-over-year sales up 147.88% but month-over-month down 20.88%. Average price declined 10.68% YoY to $9.45, indicating volume expansion YoY even as August 2026 unit velocity likely eased MoM in step with the 20.88% sales dip. The thesis is that the single-category focus magnified volatility: the 147.88% YoY surge paired with a 20.88% MoM pullback implies momentum is building on an annual basis but remains sensitive to monthly demand swings within Edible.
Positioning-wise, the 100.0% Edible reliance and a 10.68% YoY price reduction signal a value-led stance designed to capture volume, while August 2026 rank 35 in Washington Edible frames the brand as mid-pack rather than premium-tier. The combination of a 147.88% YoY sales increase and a 20.88% MoM contraction implies that HI-YAH! is trading price for share in Edible and must stabilize monthly sell-through to climb from rank 35.
Competitive Landscape
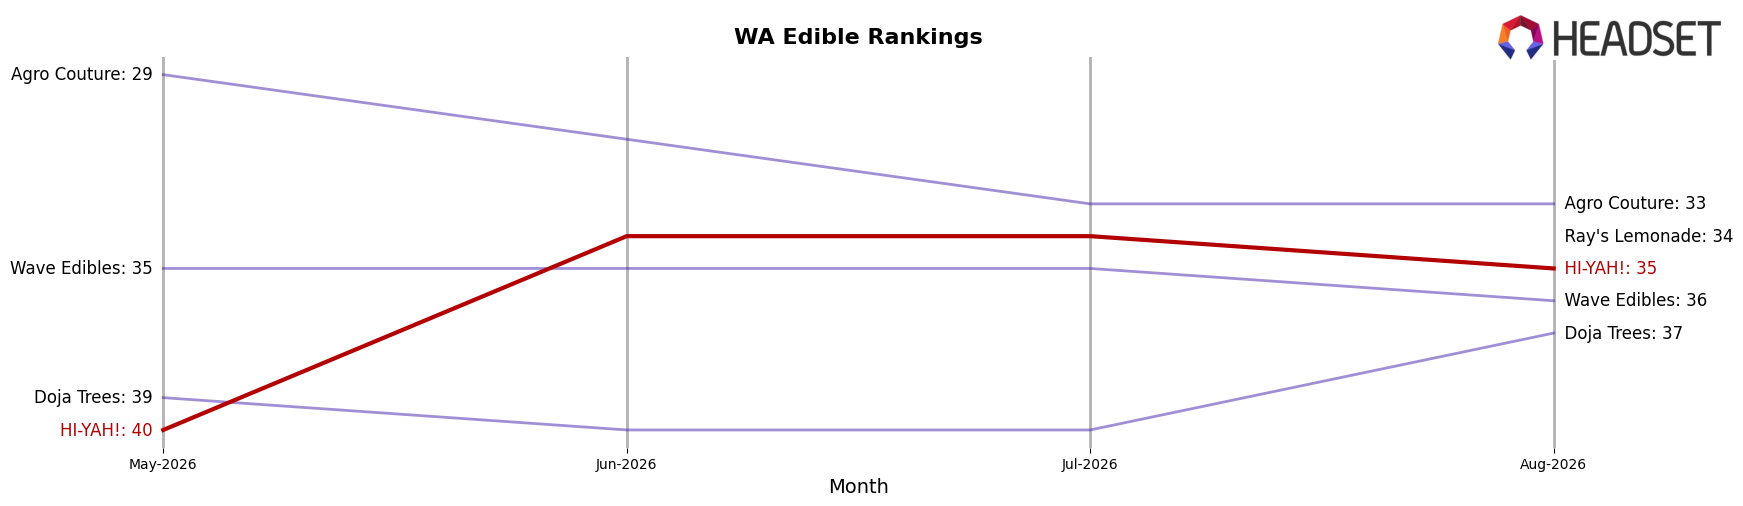
HI-YAH! sits at rank #35 in Washington Edible for August 2026, improving 11 positions from #46 year over year and up 5 spots from #40 three months ago, while its peak of #34 came in July 2026; by contrast, Wyld held #1 both this year and last with sales up 5.1% year over year, and Green Revolution stayed at #2 despite a 7.0% YoY sales decline, indicating HI-YAH!’s upward rank mobility is coming from steady incremental gains rather than top-tier volatility and implies a trajectory toward mid-tier consolidation if the month-over-month stability from July 2026 (#34) to August 2026 (#35) persists.
Notable Products
Cherry Gummies 10-Pack (100mg) posted the steepest decline in August 2026 at -74.5% MoM and slid to rank 9, while Blueberry Hash Rosin Gummies 10-Pack (100mg) fell -28.3% MoM at rank 3; this sharp downside concentrated in lower-ranked SKUs signals demand rotation away from non-CBD confections. At the top, CBD/THC 100:1 POG Gummies 10-Pack (1000mg CBD, 10mg THC) held rank 1 despite a -7.1% MoM dip, and the sibling CBD/THC 100:1 Strawberry Gummies 10-Pack (1000mg CBD, 10mg THC) in rank 2 inched up +0.5% MoM, anchoring share even as total category dollars hover near $4,796 for the leader. Eight of the top ten are Edible gummies, with CBD-dominant 100:1 SKUs sitting 1–2 while multiple hash rosin variants dropped between -17.9% and -34.5%, implying the portfolio is consolidating around higher-CBD formats over terpene-led rosin SKUs. The pattern points to HI-YAH! leaning into wellness-oriented, high-CBD gummies for commercial stability while allowing flavor-driven rosin lines to play a secondary, more volatile role.
Top Selling Cannabis Brands






Data for this report comes from real-time sales reporting by participating cannabis retailers via their point-of-sale systems, which are linked up with Headset’s business intelligence software. Headset’s data is very reliable, as it comes digitally direct from our partner retailers. However, the potential does exist for misreporting in the instance of duplicates, incorrectly classified products, inaccurate entry of products into point-of-sale systems, or even simple human error at the point of purchase. Thus, there is a slight margin of error to consider. Brands listed on this page are ranked in the top twenty within the market and product category by total retail sales volume.

