.svg)


Where to Buy
Jelly Gems is stocked at 76 licensed dispensaries across Washington, with the deepest coverage in Spokane, Vancouver, Tacoma, Everett, and Seattle. Search by ZIP code or city below to find the closest one.
Market Insights Snapshot
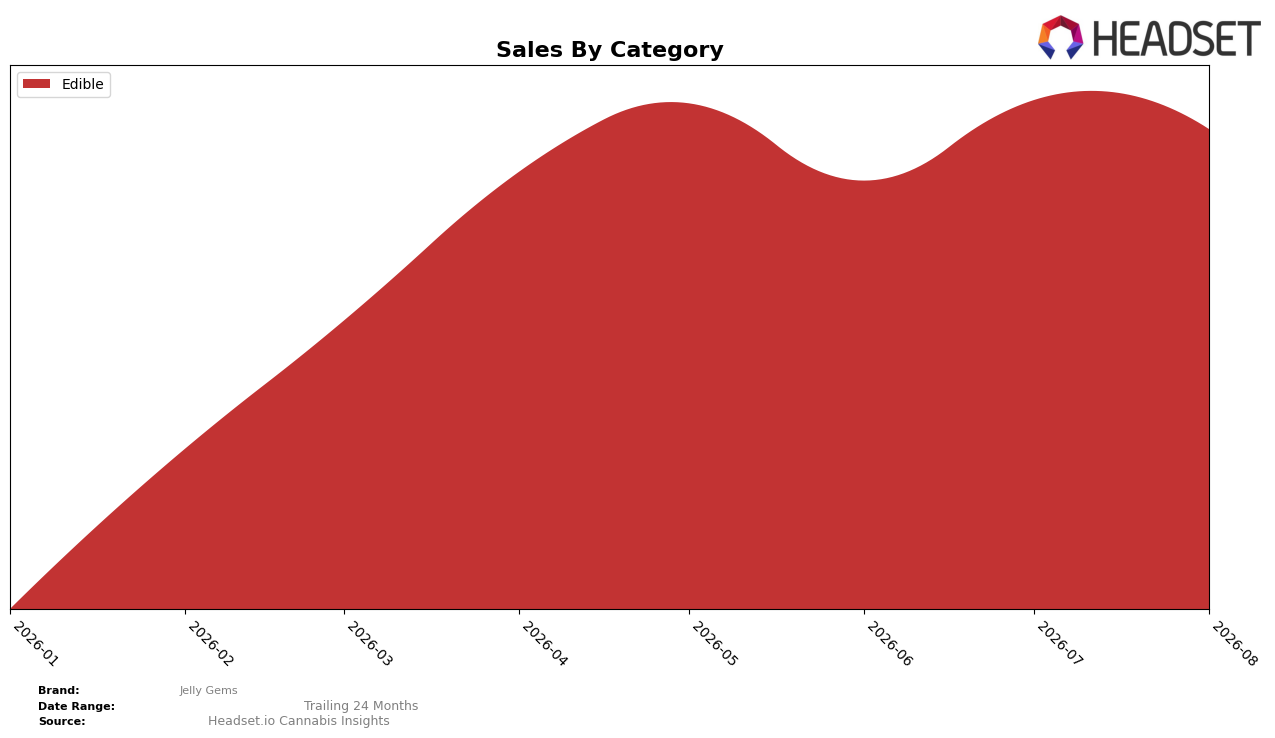
In August 2026, Jelly Gems operated as a single-category brand with Edible at 100.0% of mix and a month-over-month sales change of -5.54%, while average price held at $9.84; the Edible focus coincided with a Washington Edible rank of 30 and a zero shift in category concentration because no other categories contributed share. The pattern implies concentration risk: a 100.0% allocation to Edible combined with a -5.54% MoM contraction suggests that any category-wide softness directly transmits to total brand results, and the rank of 30 indicates mid-pack exposure without the buffer that even a 10–20% secondary category could provide.
The lack of diversification means positioning is tied to Edible velocity and pricing dynamics, where a -5.54% MoM sales change alongside a stable 100.0% mix leaves limited levers to offset seasonal or promotional swings; holding rank at 30 in Washington’s Edible category implies the brand must trade share within the same lane rather than migrate demand across formats. This pattern implies the near-term play is depth over breadth: sustaining or improving Washington Edible rank into the mid-20s while narrowing MoM declines toward 0–2% would matter more than price moves, because with 100.0% category concentration every 1% change in Edible becomes a 1% change to the brand.
Competitive Landscape
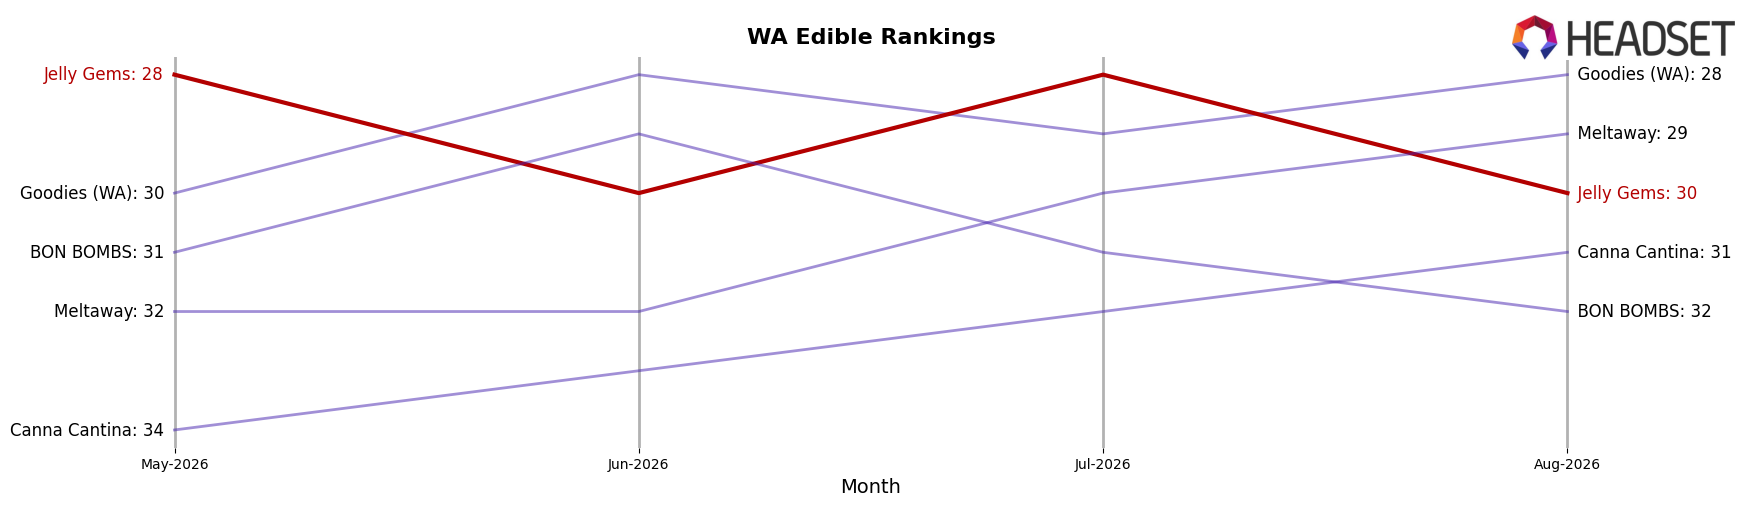
Jelly Gems sits at rank #30 in WA Edible in August 2026, slipping 2 positions from #28 in May–July to #30 in August, with no year-over-year rank reported; meanwhile its peak rank of #28 in July 2026 sits 7 tiers below the top-20 threshold, indicating recent momentum faded rather than built. In contrast, Wyld holds #1 with a 5.1% year-over-year sales gain while Jelly Gems moved down 2 ranks quarter-to-date, and Green Revolution remains #2 despite a 7.0% sales decline where Jelly Gems’ relative position still deteriorated. The gap to the #25–#20 band has widened as Jelly Gems shifted from #28 to #30 while Hot Sugar maintained #3 despite a 6.3% sales dip, implying Jelly Gems is losing share to incumbents even when top competitors are posting negative growth. The trajectory from a July 2026 peak at #28 to #30 in August 2026, alongside competitors holding #1–#3, implies Jelly Gems must arrest rank erosion quickly to avoid entrenchment in the #30± tier.
Notable Products
The steepest decline came from CBN/CBC/THC 1:1:1 Peaches & Dreams Gummies 10-Pack (100mg CBN,100mg CBC,100mg THC), which fell 16.3% MoM to rank 3 while Flow - THC/THCV/CBG 1:1:2 Tangelo Gummies 10-Pack (50mg THC, 50mg THCV, 100mg CBG) slid 23.2% MoM to rank 9, indicating multi-cannabinoid novelty blends are losing momentum relative to simpler formulas. In contrast, Night- CBD/CBN/THC 2:1:1 Slumberberry Gummies 10-Pack (200mg CBD, 100mg CBN, 100mg THC) rose 20.0% MoM to rank 1 and Happy - CBC/CBG/THC 1:1:1 Sativa Chuckleberry Gummies 10-Pack (100mg CBC, 100mg CBG, 100mg THC) jumped 36.6% MoM to rank 2, while Chill - CBD/THC 5:1 Sootheberry Gummies 10-Pack (500mg CBD, 100mg THC) advanced 30.5% MoM at rank 7, pointing to consumer preference clustering around clear need-states like sleep, mood, and high-CBD comfort. Eight of the top ten are Edible SKUs within the gummy format, and the top two ranks both sit in August 2026, concentrating demand in a narrow form factor even as lower-ranked experimental ratios contract. The mix implies Jelly Gems is tilting toward a sleep-and-mood centric portfolio where high-CBD and plainly messaged ratios can scale share faster than expansive cannabinoid stacks, suggesting resource allocation should prioritize depth in a few need-state pillars over breadth across niche blends.
Top Selling Cannabis Brands






Data for this report comes from real-time sales reporting by participating cannabis retailers via their point-of-sale systems, which are linked up with Headset’s business intelligence software. Headset’s data is very reliable, as it comes digitally direct from our partner retailers. However, the potential does exist for misreporting in the instance of duplicates, incorrectly classified products, inaccurate entry of products into point-of-sale systems, or even simple human error at the point of purchase. Thus, there is a slight margin of error to consider. Brands listed on this page are ranked in the top twenty within the market and product category by total retail sales volume.

