.svg)


Market Insights Snapshot
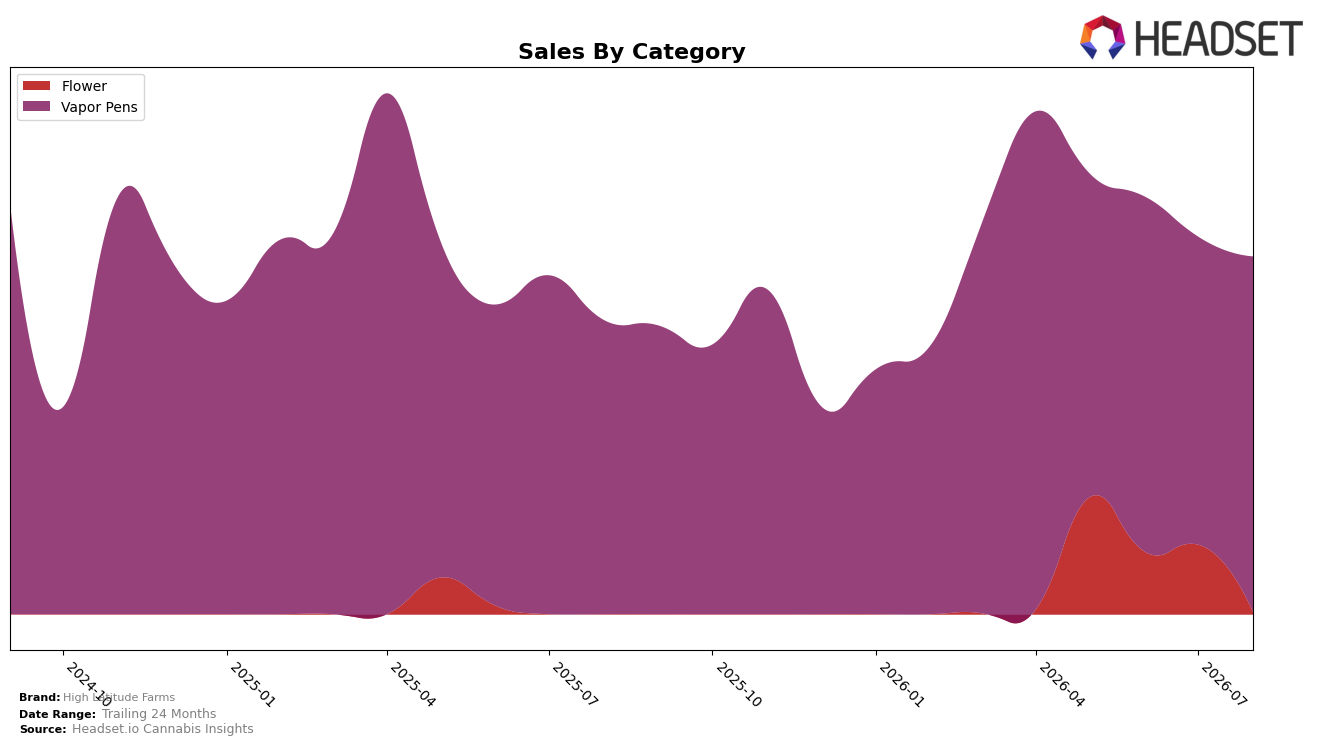
High Latitude Farms concentrated 99.41% of August 2026 sales in Vapor Pens, with Flower reduced to 0.59% share as month-over-month Flower sales fell 96.99% while Vapor Pens grew 15.46% MoM. Year over year, Vapor Pens rose 20.96% and overall brand sales increased 21.67%, alongside an 11.83% YoY increase in average price, pointing to mix-led and pricing-driven gains anchored in a single category. With Vapor Pens ranked 46 in Oregon and the top-category share near total, the thesis is that the brand’s growth is tied to deepening penetration within a narrow lane rather than broadening category presence.
The sharp MoM contraction in Flower to 0.59% share and the simultaneous 15.46% MoM expansion in Vapor Pens indicate resource allocation and consumer pull are consolidating around one format, which elevates exposure to category-specific volatility but supports focused pricing power given the 11.83% YoY price lift. Because the Vapor Pens rank sits at 46 in Oregon while category share reached 99.41%, the positioning implies a specialist strategy: defensible within a niche and scalable only if rank improves or adjacent categories recover from a 96.99% MoM decline, suggesting future share gains depend more on intra-category climb than cross-category expansion.
Competitive Landscape
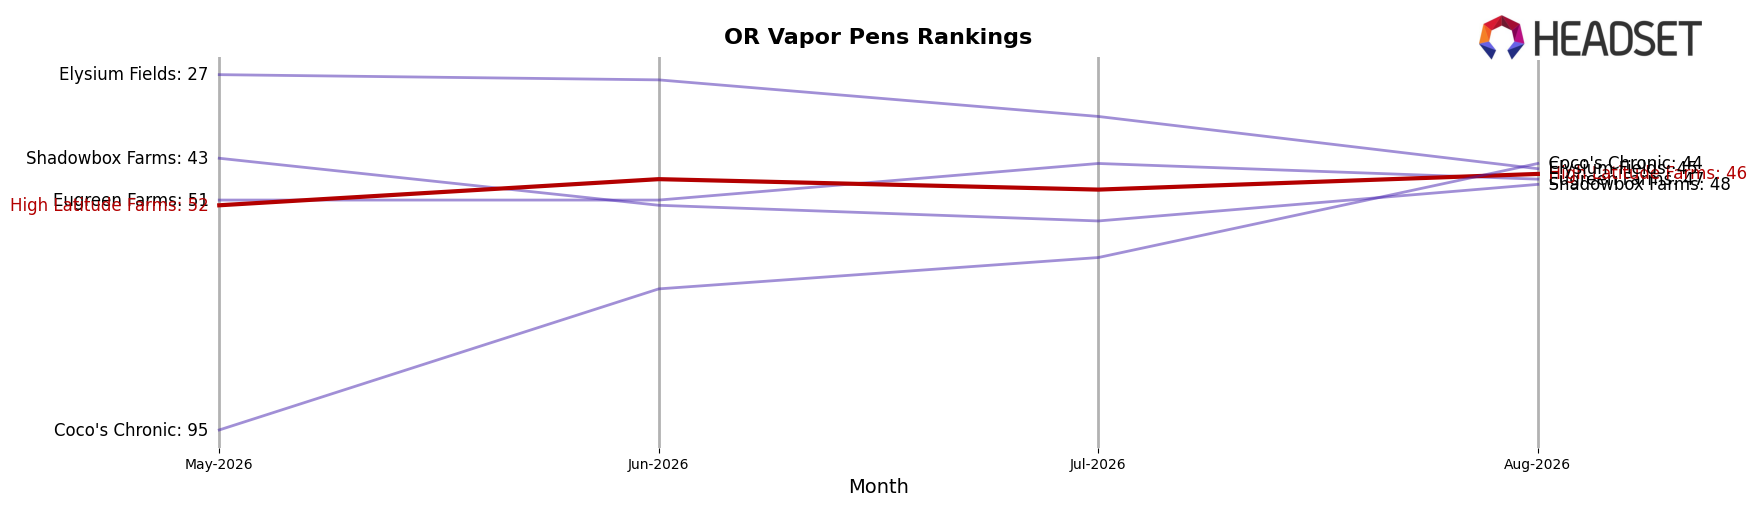
High Latitude Farms sits at rank #46 in OR Vapor Pens in August 2026, improving 5 positions from #51 year over year and climbing 6 spots from #52 since May 2026, while still 8 ranks below its peak of #38 from April 2025; meanwhile, Buddies advanced from #2 to #1 and Entourage Cannabis / CBDiscovery slipped from #1 to #2 with a -22.8% YoY sales change, indicating the top tier is reshuffling as High Latitude Farms edges upward from the lower mid-pack. This combination of a 5-rank YoY gain and a 6-step rise over the last three months, against competitors like Mule Extracts moving from #4 to #3 and Hellavated easing from #3 to #4 with -3.7% YoY, implies that High Latitude Farms’ rank trajectory is improving but still leaves meaningful ground to close before re-entering the top 40.
Notable Products
Candied Oranges Cured Resin Cartridge (1g) posted the standout move in August 2026 with a 535.4% month-over-month surge to rank 3, while Great White Shark CDT Distillate Cartridge (1g) fell 67.0% to rank 6. Peanut Tart Distillate CDT Cartridge (1g) also expanded 67.7% to rank 2, narrowing the gap with Super Boof CDT Distillate Cartridge (1g) at rank 1. With eight of the top ten in Vapor Pens and both cured resin and CDT distillate formats gaining share at the top, the mix points to a pivot toward terp-forward cartridges that can be scaled quickly across a limited set of hero SKUs.
Top Selling Cannabis Brands






Data for this report comes from real-time sales reporting by participating cannabis retailers via their point-of-sale systems, which are linked up with Headset’s business intelligence software. Headset’s data is very reliable, as it comes digitally direct from our partner retailers. However, the potential does exist for misreporting in the instance of duplicates, incorrectly classified products, inaccurate entry of products into point-of-sale systems, or even simple human error at the point of purchase. Thus, there is a slight margin of error to consider. Brands listed on this page are ranked in the top twenty within the market and product category by total retail sales volume.

