.svg)


Market Insights Snapshot
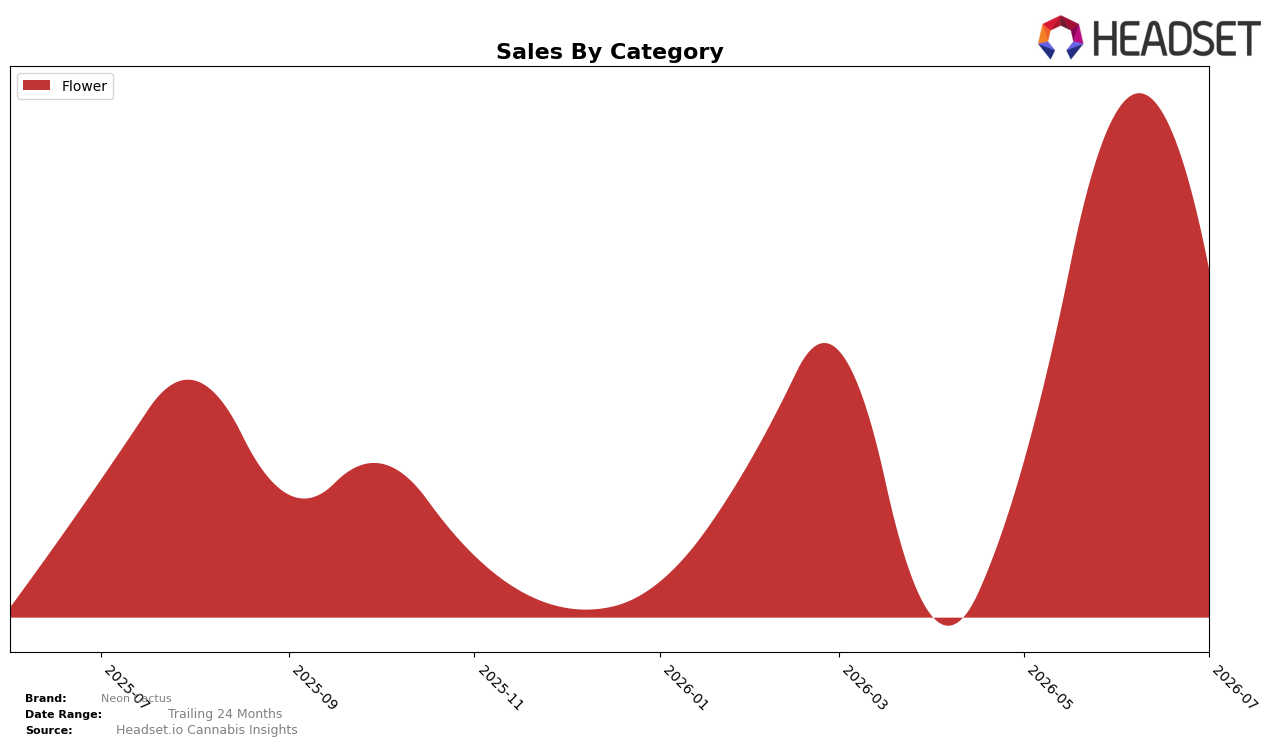
In July 2026, Neon Cactus operated as a single-category brand with Flower accounting for 100.0% of sales share and holding rank 32 in Flower within Nevada. Year over year, Flower sales rose 110.5%, while average price declined 11.5%, and month over month sales fell 28.5% alongside a rank that remained at position 32. The combination of triple-digit YoY growth and a double-digit MoM pullback within a 100.0% Flower mix implies concentration risk: the brand is scaling volume through price compression while lacking category diversification to buffer monthly volatility.
The mix staying at 100.0% Flower and the stable rank 32 in Nevada together with an 11.5% YoY price decrease and a 28.5% MoM sales decline indicate a price-led volume strategy that may cap upward rank mobility in near term periods. Given July 2026 YoY sales growth of 110.5% against a flat category position at rank 32, the pattern implies Neon Cactus is acquiring share primarily from price elasticity within Flower rather than from assortment breadth or premiumization, which constrains resilience to MoM swings and suggests the next gains will require either category expansion or a shift toward higher-margin Flower segments.
Competitive Landscape
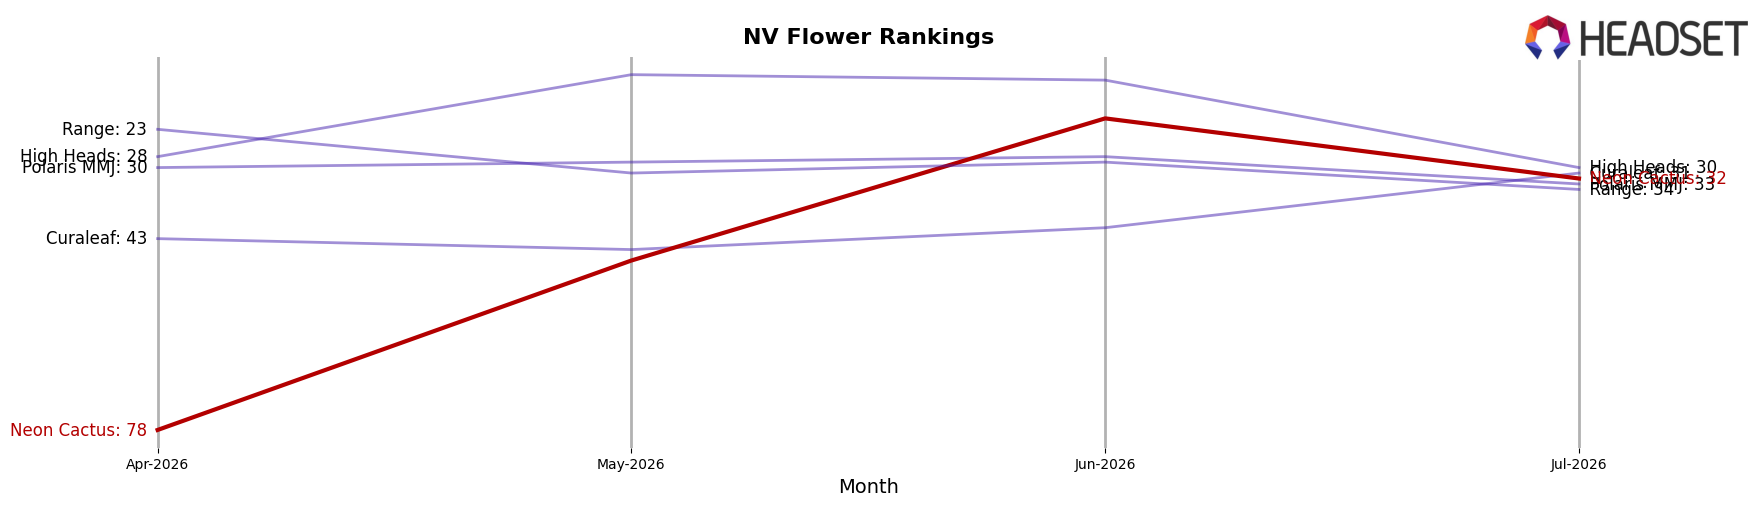
Neon Cactus is ranked #32 in July 2026 in NV Flower, improving 21 positions from #53 year over year, while its three-month climb from #78 to #32 adds a 46-rank jump; however, the brand sits below its peak at #21 in June 2026, a slide of 11 positions month over month. In the same window, STIIIZY holds #1 after rising from #2 year over year and posted 31.5% YoY sales growth, whereas RYTHM slipped from #1 to #2 with a 12.7% YoY sales decline, indicating that Neon Cactus’s upward rank momentum is occurring amid leadership churn at the top. The rank trajectory—rapid recovery from #78 in April 2026–May 2026 range to #32 in July 2026 but not sustaining the #21 peak—implies Neon Cactus is gaining mid-tier share but must convert short-term surges into consistent top-25 presence to avoid reverting after volatility at the category’s summit.
Notable Products
Amnesia Lemon (14g) delivered the standout move in July 2026 with a +207.6% month-over-month surge to rank 1, eclipsing steep declines like Grape Pie (14g) at -58.3% and Cheddar Cheeze Popcorn (14g) at -57.8%, which both slid into ranks 8 and 6 respectively. Bubblegum Gelato (14g) fell -48.1% to rank 2 while Las Vegas Lemon (14g) dropped -41.0% to rank 3, and four of the top ten are Flower SKUs anchored by citrus and grape profiles, indicating a concentration that is bifurcating between a single breakout and multiple retrenchments. The mix of a triple-digit leader at rank 1 alongside three declines worse than -40% within the top 10 signals a portfolio pivot toward one hero SKU while legacy flavors are being deprioritized or losing repeat traction.
Top Selling Cannabis Brands






Data for this report comes from real-time sales reporting by participating cannabis retailers via their point-of-sale systems, which are linked up with Headset’s business intelligence software. Headset’s data is very reliable, as it comes digitally direct from our partner retailers. However, the potential does exist for misreporting in the instance of duplicates, incorrectly classified products, inaccurate entry of products into point-of-sale systems, or even simple human error at the point of purchase. Thus, there is a slight margin of error to consider. Brands listed on this page are ranked in the top twenty within the market and product category by total retail sales volume.

