.svg)


Market Insights Snapshot
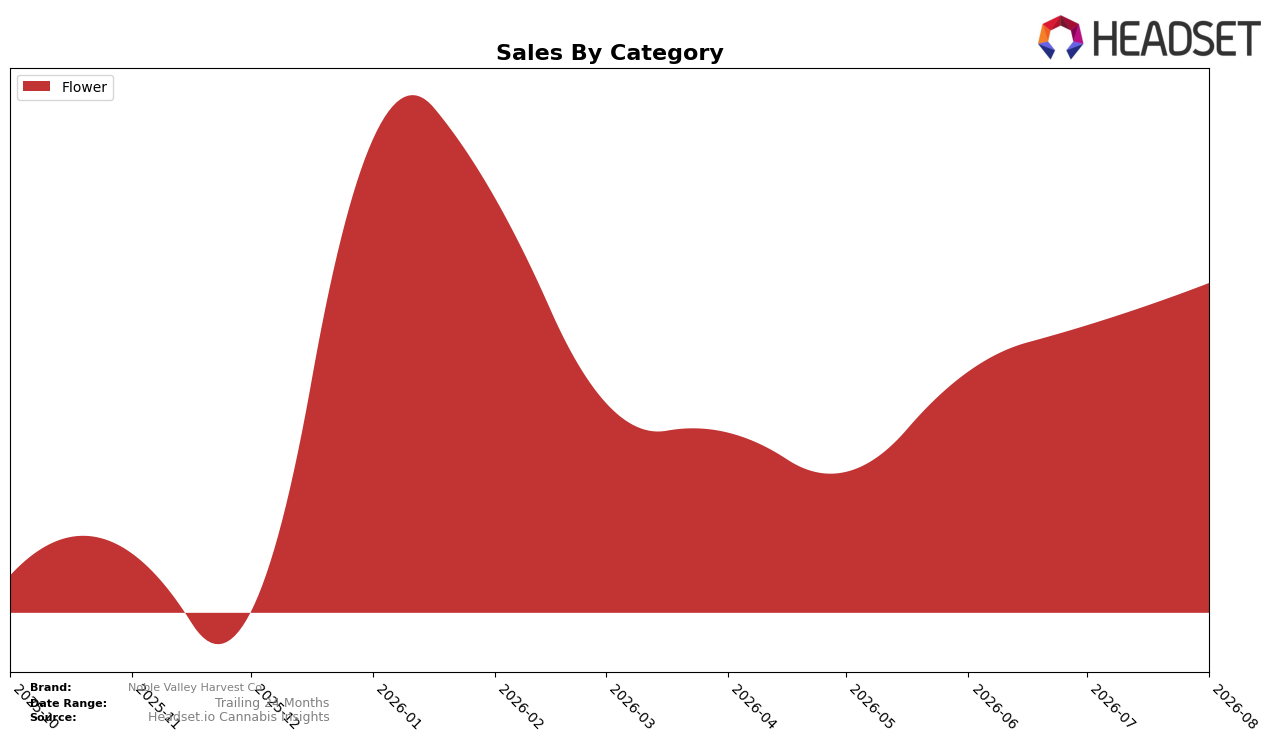
In August 2026, Noble Valley Harvest Co operated as a single-category brand with Flower at 100.0% category share and an 8.67% month-over-month sales lift, while year-over-year change for Flower was not reported. Average price held at $58.75, with no year-over-year price delta available and no month-over-month price change cited, indicating the 8.67% MoM uptick came from volume rather than pricing. The thesis is that a concentrated 100.0% mix paired with volume-driven MoM growth compresses risk into one category and one pricing lane, making near-term gains dependent on sustaining Flower velocity.
The single-category concentration aligns Noble Valley Harvest Co to compete directly on Flower velocity in New Jersey, where the brand ranked 44 in Flower during August 2026 and posted an 8.67% MoM lift against a flat reported YoY baseline. A 100.0% share in Flower means any rank movement will be highly sensitive to incremental MoM changes, and holding price near $58.75 suggests trading up is limited without risking conversion. The thesis is that maintaining or improving the rank 44 position will require continued volume gains in Flower or selective price experimentation, because diversification is currently at 0% outside Flower.
Competitive Landscape
Noble Valley Harvest Co sits at rank #44 in NJ Flower for August 2026, moving up 12 positions from #56 in May 2026 but still below its peak rank of #38 reached in February 2026; in contrast, Ozone holds #1 while its sales are down 18.55% year over year and Find. climbed to #2 with a 40.50% YoY sales increase. The competitive ceiling is tightening as Good Green rose to #3 with 91.62% YoY growth and RYTHM is #5 despite a 7.27% YoY decline, indicating Noble Valley Harvest Co’s recent 12-rank rebound is happening amid aggressive upward mobility by mid-tier leaders and softening at the top; this trajectory implies the brand is positioned for incremental share capture if it translates rank gains since May 2026 into sustained velocity before churn at the top layer eases.

Notable Products
TERPLE (7g) posted the steepest decline in August 2026, down 99.29% MoM and sliding to rank 10, while Queen of the South #11 (7g) also fell 87.34% MoM at rank 9; by contrast, Wingsuit #3 (7g) rose 49.67% MoM to hold rank 1 with $86,074. MAC 1 (7g) advanced 32.11% MoM to rank 2 and Island Boi #10 (7g) gained 29.69% MoM at rank 3, yet JOMO #19 (7g) dropped 57.79% MoM to rank 4, signaling a split between momentum leaders and laggards. All top-10 SKUs are Flower, concentrating category risk even as two Death by Boof formats entered at ranks 5 and 7, implying reliance on a narrow form factor that amplifies volatility. The pattern suggests Noble Valley Harvest Co is consolidating volume into a few high-velocity Flower SKUs while allowing tail items to cycle down, pointing to a pruning strategy that prioritizes rank stability over breadth.
Top Selling Cannabis Brands






Data for this report comes from real-time sales reporting by participating cannabis retailers via their point-of-sale systems, which are linked up with Headset’s business intelligence software. Headset’s data is very reliable, as it comes digitally direct from our partner retailers. However, the potential does exist for misreporting in the instance of duplicates, incorrectly classified products, inaccurate entry of products into point-of-sale systems, or even simple human error at the point of purchase. Thus, there is a slight margin of error to consider. Brands listed on this page are ranked in the top twenty within the market and product category by total retail sales volume.

