.svg)


Market Insights Snapshot
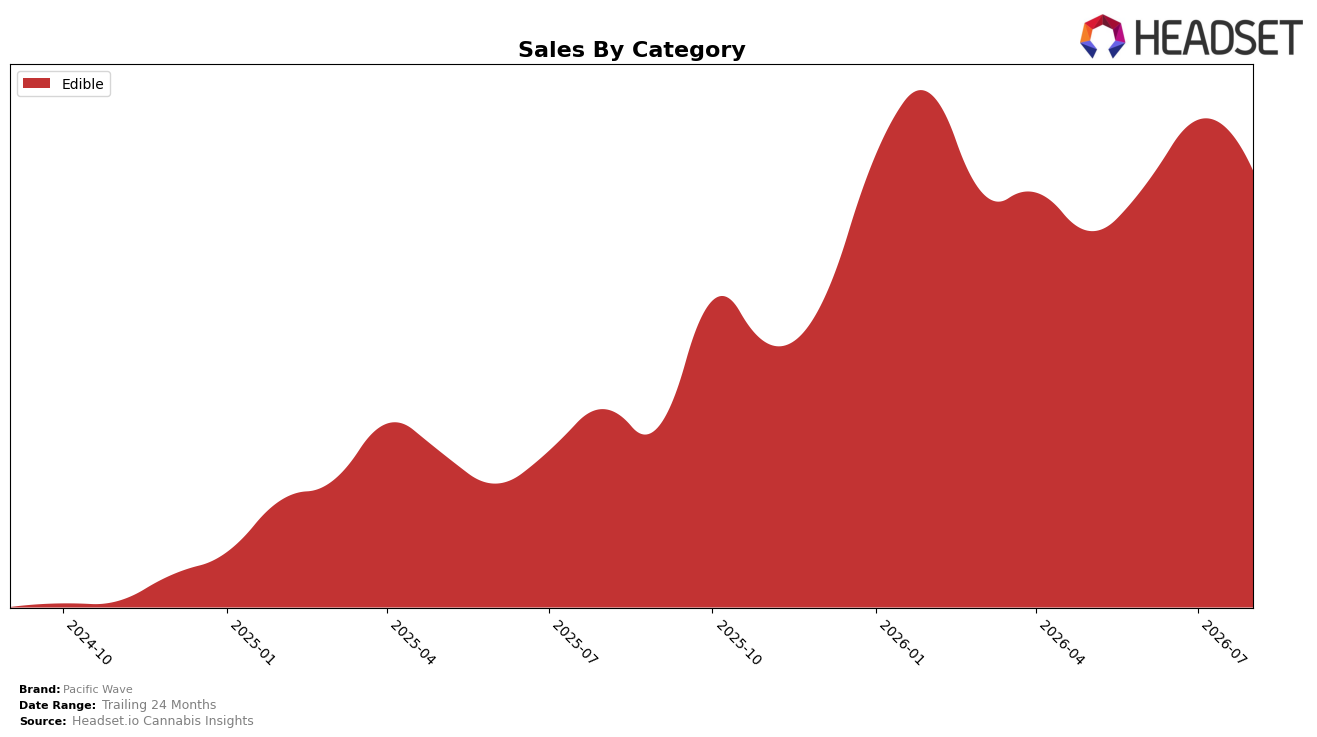
Pacific Wave operated as a single-category brand in August 2026, with Edible accounting for 100.0% of sales and a year-over-year increase of 119.7% alongside a month-over-month decline of 10.4%. Average price fell 12.2% year over year to $3.80, while the brand held rank 33 in Edible within Oregon, indicating volume-led gains despite a short-term pullback. The pattern implies mix concentration paired with discount-enabled velocity: all growth is flowing through Edible, and the double-digit monthly dip alongside a lower price indicates sensitivity to promotional intensity rather than category diversification.
With 100.0% of sales in Edible and a rank of 33 in Oregon, Pacific Wave’s positioning leans on price-accessible, high-frequency Edible formats where a 12.2% price decline traded for 119.7% year-over-year growth but left exposure to a 10.4% monthly retracement. The inference is a price-elastic base that scales when discounts deepen but softens when promotional pressure eases, suggesting near-term share can rise if prices hold near $3.80 while rank mobility from 33 will rely more on ticket-size or multi-pack strategies than on category expansion.
Competitive Landscape
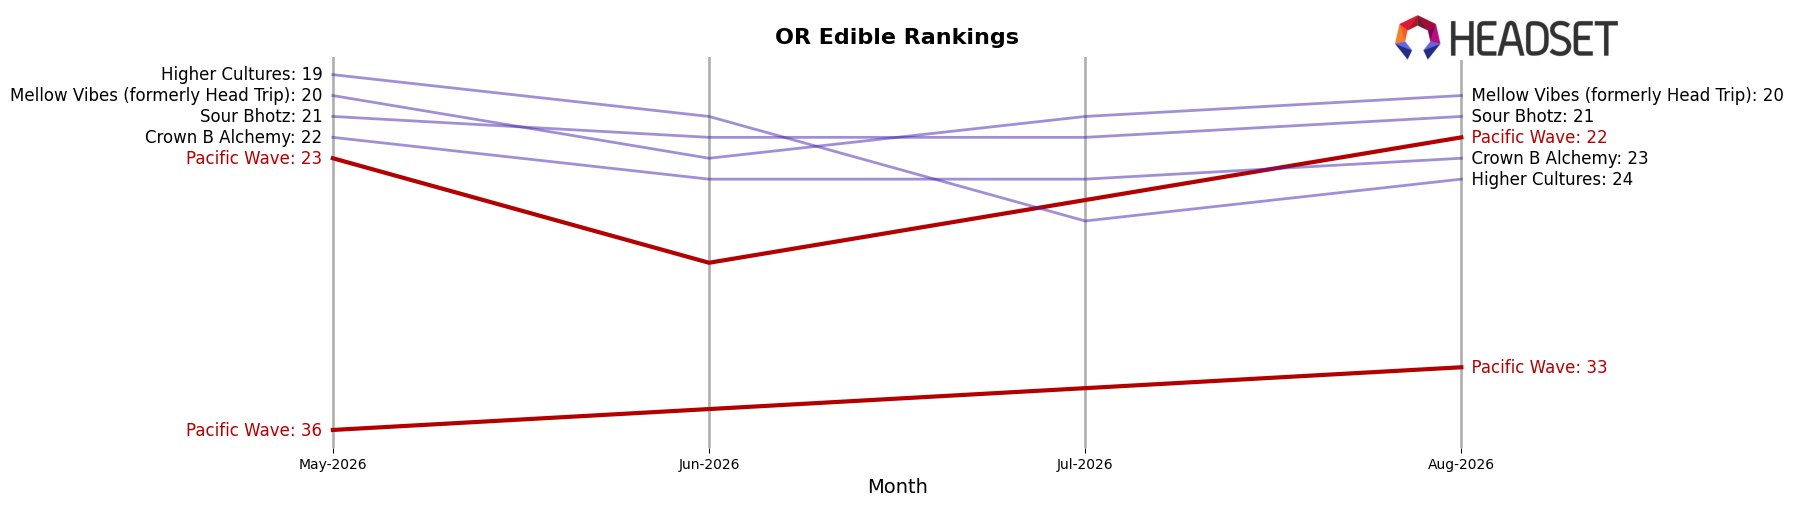
Pacific Wave sits at rank #33 in OR Edible in August 2026, improving 10 positions from rank #43 year over year, while slipping 1 spot from its peak rank #32 set in February 2026 and easing 3 places from #36 in May 2026, implying momentum that is recent but not yet locked in. At the top of the table, Wyld holds #1 with a -1.5% year-over-year sales change and Gron / Grön remains #2 with a -5.8% change, whereas Mule Extracts at #5 is growing at +2.8%, indicating that Pacific Wave’s 10-rank YoY climb is occurring as top incumbents contract and at least one challenger expands. This mix—Pacific Wave’s single-digit rank drift since February 2026 alongside a double-digit YoY rank gain—implies a brand consolidating mid-tier position, with share available to capture if it converts small rank improvements into sustained month-to-month advances.
Notable Products
Cinnamon Hard Candy 10-Pack (100mg) posted the largest move in August 2026 with a +135.5% month-over-month surge that vaulted it to rank 6, while Blue Raspberry Giggle Gummies 10-Pack (100mg) fell -48.1% to rank 7. Strawberry Banana Giggle Gummies 10-Pack (100mg) grew +19.4% and held rank 1, whereas Sour Cherry Giggle Gummies 10-Pack (100mg) declined -23.4% at rank 3. With eight of the top ten coming from the Edible gummies family and only one SKU exceeding $4,500, the mix tilts toward affordable, flavor-driven volume where volatility can be used to rotate shelf space toward emerging winners.
Top Selling Cannabis Brands






Data for this report comes from real-time sales reporting by participating cannabis retailers via their point-of-sale systems, which are linked up with Headset’s business intelligence software. Headset’s data is very reliable, as it comes digitally direct from our partner retailers. However, the potential does exist for misreporting in the instance of duplicates, incorrectly classified products, inaccurate entry of products into point-of-sale systems, or even simple human error at the point of purchase. Thus, there is a slight margin of error to consider. Brands listed on this page are ranked in the top twenty within the market and product category by total retail sales volume.

