.svg)


Where to Buy
Surfr Select is stocked at 33 licensed dispensaries across Oregon, with the deepest coverage in Portland, Bend, Corvallis, Eugene, and Ontario. Search by ZIP code or city below to find the closest one.
Market Insights Snapshot
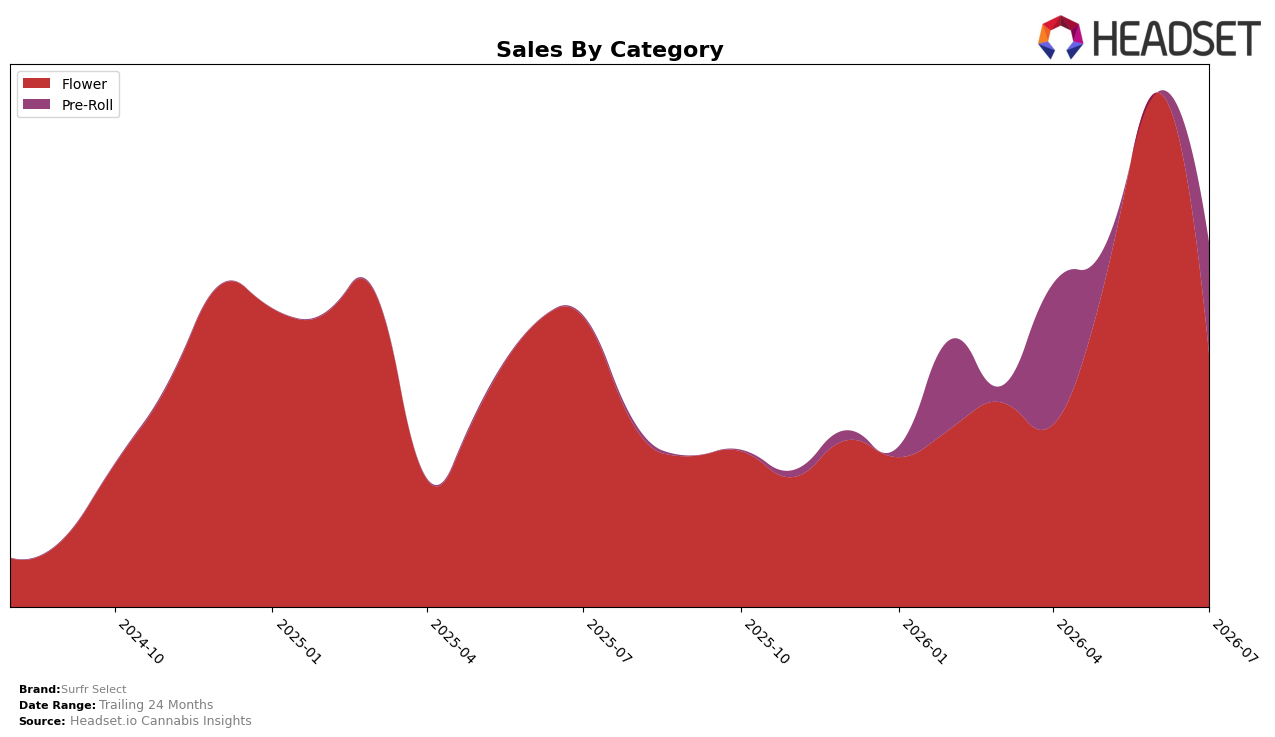
Surfr Select’s category mix in July 2026 was concentrated in Flower at 69.35% share (ranked 55th in Oregon Flower) and complemented by Pre-Roll at 30.65% share, with a brand-level year-over-year sales increase of 24.91% and an average price up 9.86%. Flower volume pressure is evident with Flower sales down 12.96% year over year and down 50.95% month over month, while Pre-Roll expanded its footprint to 30.65% share alongside a 7,983.19% year-over-year category growth signal from a small base. The pattern implies a deliberate pivot away from volatile Flower volume toward a two-category portfolio where Pre-Roll acts as the growth engine while Flower remains the anchor despite a July 2026 retrenchment.
The shift positions Surfr Select to trade mix for margin and shelf breadth: the higher average price of $28.83 alongside a 9.86% price lift and a 50.95% month-over-month contraction in Flower suggests tighter SKU or distribution focus, while a 30.65% Pre-Roll share and a 7,983.19% year-over-year surge indicate accelerated trial and velocity in a format with faster repeat. Holding a 69.35% Flower share yet sitting at rank 55 in Oregon Flower, combined with a 24.91% brand sales increase, implies the brand’s near-term positioning is to consolidate core Flower presence while using Pre-Roll growth to climb category ranks and smooth month-to-month volatility.
Competitive Landscape
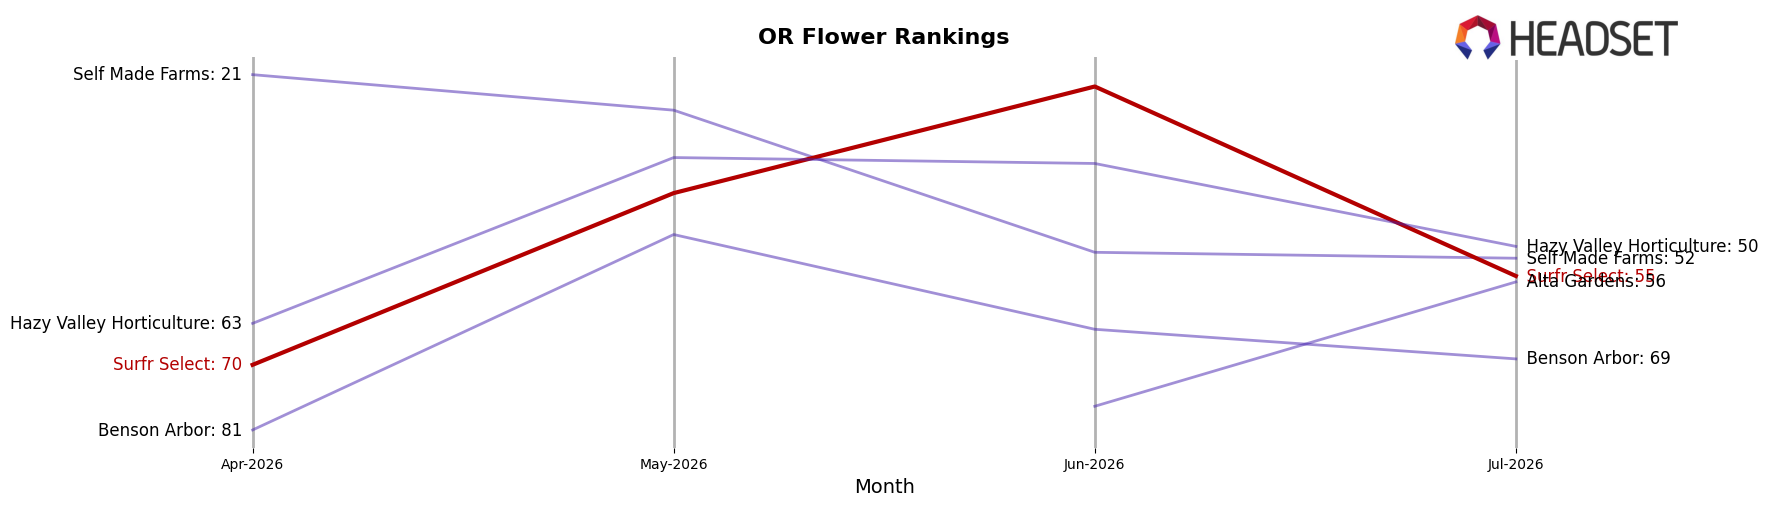
Surfr Select sits at rank #55 in Oregon Flower for July 2026, down 9 positions year over year from #46, yet up 15 positions versus April 2026’s #70. While Surfr Select slipped YoY, PRUF Cultivar / PRŪF Cultivar held #1 with a 50.7% YoY sales increase and Grown Rogue advanced to #2 from #3 with 53.5% YoY growth, indicating that gains are concentrating at the top as Surfr Select drifts in the mid-pack. Surfr Select’s peak at #23 in June 2026 followed by a drop to #55 in July 2026, alongside Otis Garden moving from #12 YoY to #4 with 86.2% growth, implies momentum volatility and share being ceded to faster-advancing leaders.
Notable Products
Biscotti #9 (1g) posted the steepest decline at -95.13% MoM while sliding to rank 8, and Pineapple Zikigai (1g) similarly fell -89.82% MoM at rank 9, signaling a sharp retreat for several legacy Flower SKUs that had previously held higher positions. In contrast, Zero Gravity (1g) surged +316.93% MoM into rank 2 and Butter Kush (1g) rose +128.58% MoM to rank 3, with three of the top ten occupied by 1g Flower SKUs alongside multiple Bulk Flower entries, concentrating demand around Flower rather than Pre-Roll despite Grandpa's Gun Chest Pre-Roll (0.7g) at rank 1 and $54,386 in sales. The coexistence of outsized gains in new or revived 1g Flower items with -95.03% to -69.62% drops across other Flower SKUs implies rapid SKU cycling within Flower, pushing Surfr Select toward a tighter, hit-driven Flower mix that prioritizes a few momentum strains over a broad lineup.
Top Selling Cannabis Brands






Data for this report comes from real-time sales reporting by participating cannabis retailers via their point-of-sale systems, which are linked up with Headset’s business intelligence software. Headset’s data is very reliable, as it comes digitally direct from our partner retailers. However, the potential does exist for misreporting in the instance of duplicates, incorrectly classified products, inaccurate entry of products into point-of-sale systems, or even simple human error at the point of purchase. Thus, there is a slight margin of error to consider. Brands listed on this page are ranked in the top twenty within the market and product category by total retail sales volume.

