.svg)


Where to Buy
Highly Cultivated is stocked at 31 licensed dispensaries across Oregon, with the deepest coverage in Portland, Bend, Medford, Springfield, and Eugene. Search by ZIP code or city below to find the closest one, or filter by product type if you are after a specific format.
Market Insights Snapshot
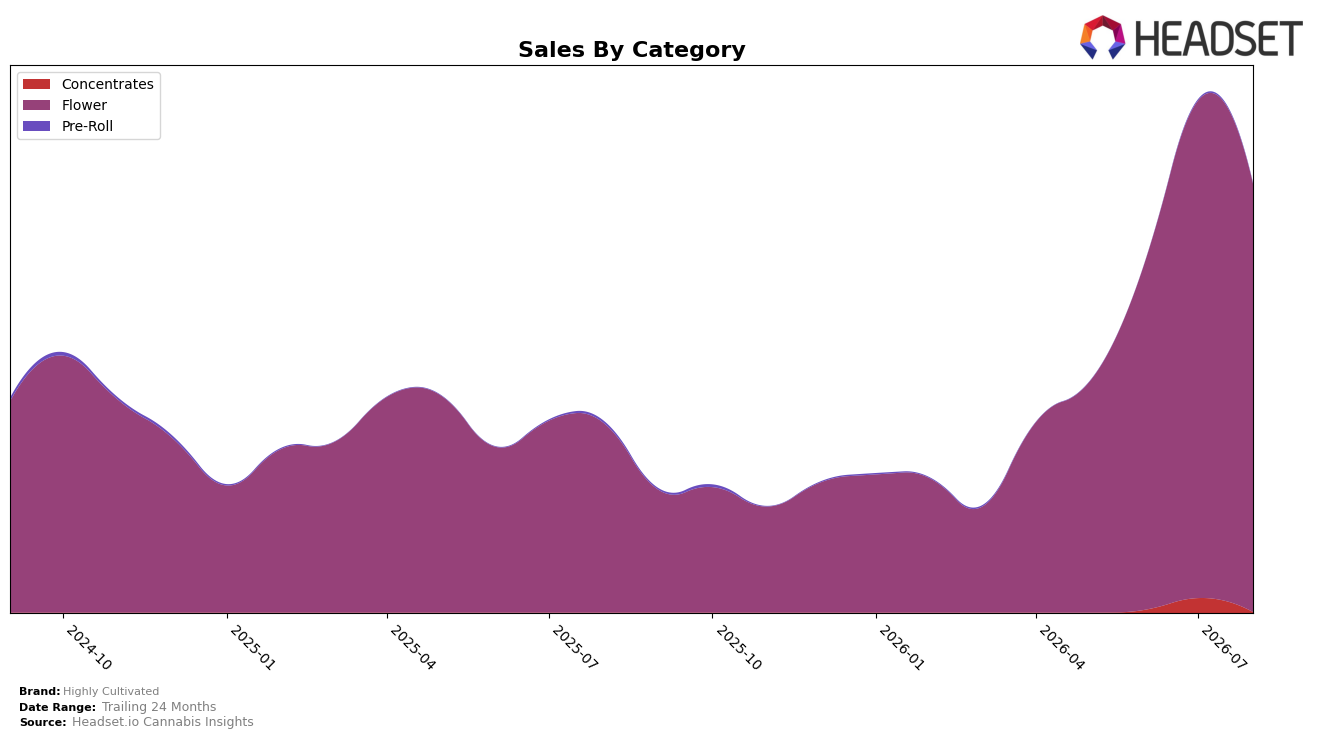
Highly Cultivated’s mix in August 2026 is overwhelmingly Flower at 99.76% share with a year-over-year increase of 126.50% and a month-over-month decline of 13.92%, while Pre-Roll holds 0.12% share with a 73.96% year-over-year drop and a 52.51% month-over-month decline. Concentrates sits at 0.12% share with a 96.35% month-over-month decline and no comparable year-over-year read, and the brand’s overall sales are up 124.78% year-over-year with an average price up 61.07%. With a Flower rank of 40 in Oregon, the pattern implies a near-single-category strategy where volume gains are tied to Flower pricing and distribution, but recent month-over-month pullback and erosion in tiny satellite categories raise short-term exposure to category-specific volatility.
The tilt toward Flower at 99.76% share combined with a 13.92% month-over-month contraction suggests positioning as a focused Flower specialist rather than a portfolio balancer, and the 61.07% average price increase indicates the brand is leaning into higher ticket offerings within that lane. With Pre-Roll shrinking 52.51% month-over-month and 73.96% year-over-year and Concentrates collapsing 96.35% month-over-month, the lack of a secondary engine limits cross-category defensiveness, implying that sustaining August 2026 momentum relies on holding or improving the rank 40 slot in Oregon Flower while selectively rebuilding a sub-1% hedge to buffer demand swings.
Competitive Landscape
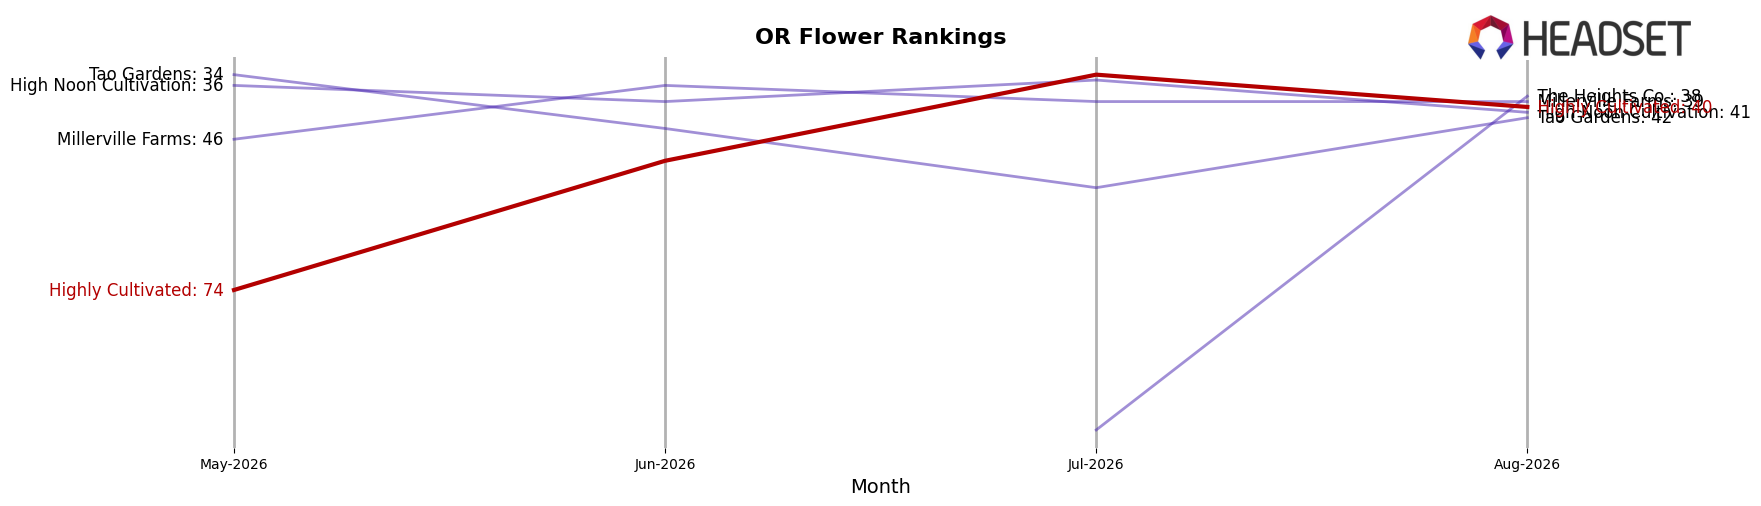
Highly Cultivated sits at rank #40 in OR Flower for August 2026, rising 52 positions year over year from #92, but only 34 positions from May–June levels to #74 three months ago, indicating a late-summer acceleration after a mid-year stall; the brand also slipped 6 spots from its peak #34 in July 2026, suggesting volatility around its ceiling. In contrast, Grown Rogue advanced from #3 to #1 with a 49% YoY sales lift while Oregrown climbed from #23 to #3 on a 182% YoY surge, and Panda Farms jumped from #99 to #4 with four-digit YoY growth, indicating that peers are converting momentum into top-5 positions faster than Highly Cultivated is consolidating its gains; the trajectory implies that without converting July’s peak into sustained top-35 stability, Highly Cultivated risks being outpaced by faster-climbing competitors in the next two to three months.
Notable Products
Bubblegum Gushers (Bulk) posted the steepest decline in August 2026 at -56.8% MoM, sliding to rank 7, while Triple Cake (Bulk) also contracted -53.3% MoM to rank 8; together these drops indicate bulk units are ceding velocity to smaller formats. Cap N Crunch (Bulk) fell -33.1% MoM at rank 2 as Delta Diamonds (1g) rose +22.3% MoM to rank 5, a divergence that points to price-pack shifts toward 1g and 3.5g sizes over bulk. With Flower occupying all top-10 ranks and two SKUs tied at rank 7, the assortment is concentrated in a single category and dependent on a few rank-leading strains, implying a near-term need to rebalance toward higher-turn small packs and stabilize bulk inventory.
Top Selling Cannabis Brands






Data for this report comes from real-time sales reporting by participating cannabis retailers via their point-of-sale systems, which are linked up with Headset’s business intelligence software. Headset’s data is very reliable, as it comes digitally direct from our partner retailers. However, the potential does exist for misreporting in the instance of duplicates, incorrectly classified products, inaccurate entry of products into point-of-sale systems, or even simple human error at the point of purchase. Thus, there is a slight margin of error to consider. Brands listed on this page are ranked in the top twenty within the market and product category by total retail sales volume.

