.svg)


Where to Buy
B-Sides (MO) is stocked at 37 licensed dispensaries across Missouri, New York, and 3 other states, 18 of them in Missouri, with the deepest coverage in Kansas City, Branson, Columbia, Creve Coeur, and Florissant. Search by ZIP code or city below to find the closest one, or filter by product type if you are after a specific format.
Market Insights Snapshot
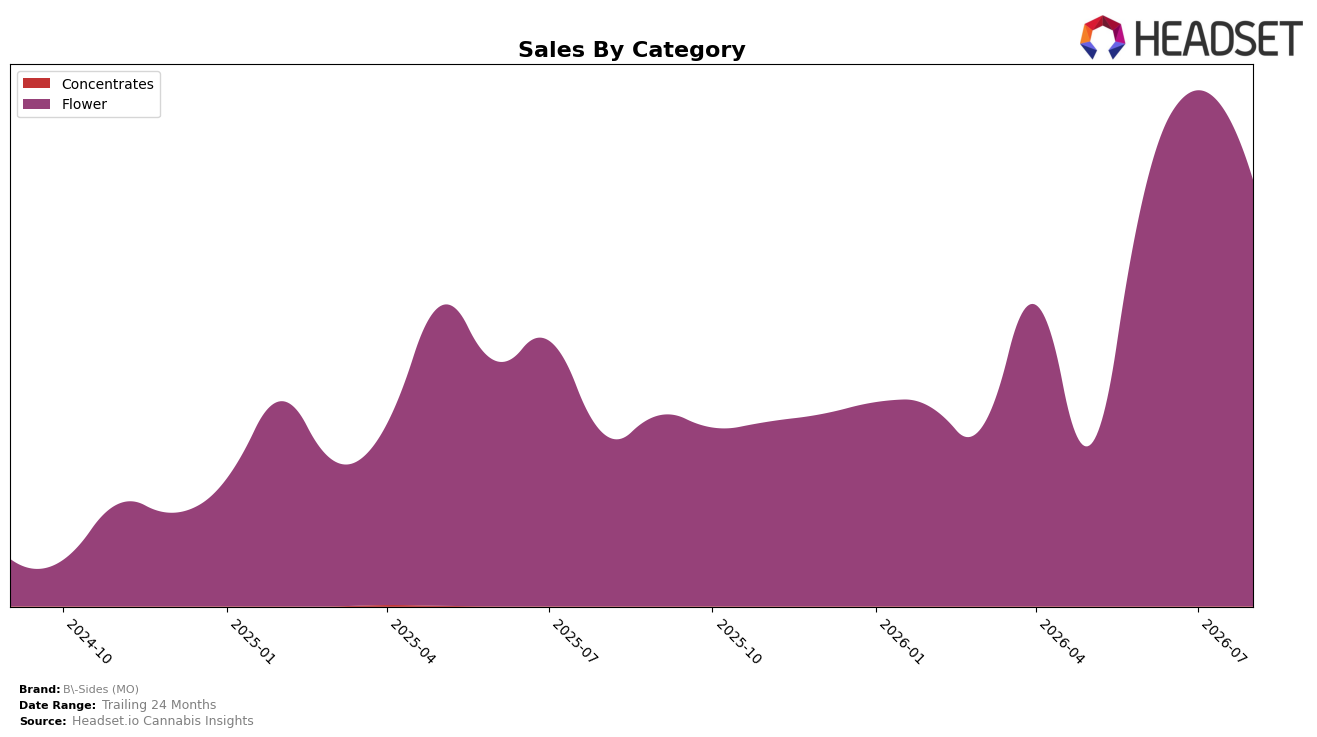
In August 2026, B-Sides (MO) operated as a single-category brand, with Flower accounting for 100.0% of sales and a year-over-year sales change of 147.9% alongside a month-over-month decline of 17.4%. Within Flower, the average item price fell 27.2% year over year to $68.90, while state-category rank sat at position 39 in Missouri; this combination of triple-digit YoY growth and a mid-pack rank implies a volume-led expansion tempered by recent monthly softness.
The shift toward lower pricing alongside a 147.9% YoY sales increase and a 17.4% MoM pullback suggests B-Sides (MO) is trading volume for share within Flower rather than premium positioning, given rank 39 in Missouri and a 27.2% YoY price compression. With 100.0% of sales concentrated in Flower during August 2026 and an average price at $68.90, the pattern implies limited diversification and price-sensitive demand, positioning the brand as a scale player in Flower that may be vulnerable to month-to-month volatility.
Competitive Landscape
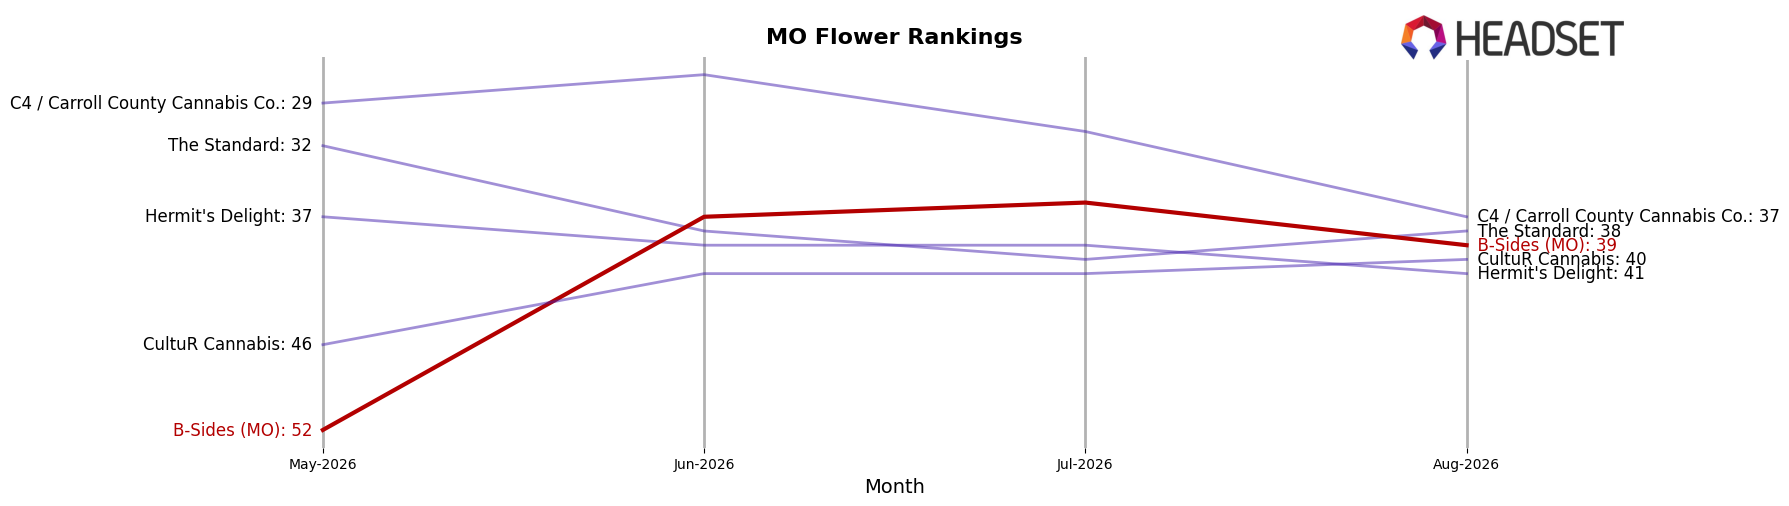
B-Sides (MO) sits at rank #39 in August 2026, improving 15 positions from #54 year over year and climbing 13 spots from #52 in May 2026; the brand also reached a peak rank of #36 in July 2026 before slipping three places month over month. In contrast, Flora Farms held at #1 year over year and remains #1 in August 2026, while Farmer G surged from #31 year over year to #5 alongside a 434.6% sales growth, indicating competitive pressure from faster risers; meanwhile, Illicit / Illicit Gardens moved from #3 year over year to #2 despite a -5.0% sales change, suggesting that rank momentum can decouple from sales direction. The pattern—double-digit rank gains year over year and quarter-to-date, but a retreat from a July 2026 peak—implies B-Sides (MO) is advancing into the mid-tier yet risks stalling without a catalyst to convert short-term spikes into sustained rank improvements.
Notable Products
First Class Funk (14g) posted the steepest movement in August 2026 with a -43.2% month-over-month decline and a drop to rank 9, while Wil-Omb (28g) also contracted by -35.8% and slipped to rank 8. Rainbow Banana #1 (14g) moved up with a +15.9% month-over-month gain and held rank 1, and Tiger Moon (14g) remained in the top three at rank 3 as Flower SKUs occupied all ten top slots, concentrating 100% of the leaderboard in one category. With eight of the top ten being 28g or 14g pack sizes and only one SKU exceeding $29,000 in August 2026, the mix points to a value-driven Flower strategy that prioritizes larger formats while pruning underperforming varietals.
Top Selling Cannabis Brands






Data for this report comes from real-time sales reporting by participating cannabis retailers via their point-of-sale systems, which are linked up with Headset’s business intelligence software. Headset’s data is very reliable, as it comes digitally direct from our partner retailers. However, the potential does exist for misreporting in the instance of duplicates, incorrectly classified products, inaccurate entry of products into point-of-sale systems, or even simple human error at the point of purchase. Thus, there is a slight margin of error to consider. Brands listed on this page are ranked in the top twenty within the market and product category by total retail sales volume.

