.svg)


Where to Buy
Crispy's is stocked at 120 licensed dispensaries across New York, with the deepest coverage in New York, Brooklyn, Queens, The Bronx, and Buffalo. Search by ZIP code or city below to find the closest one.
Market Insights Snapshot
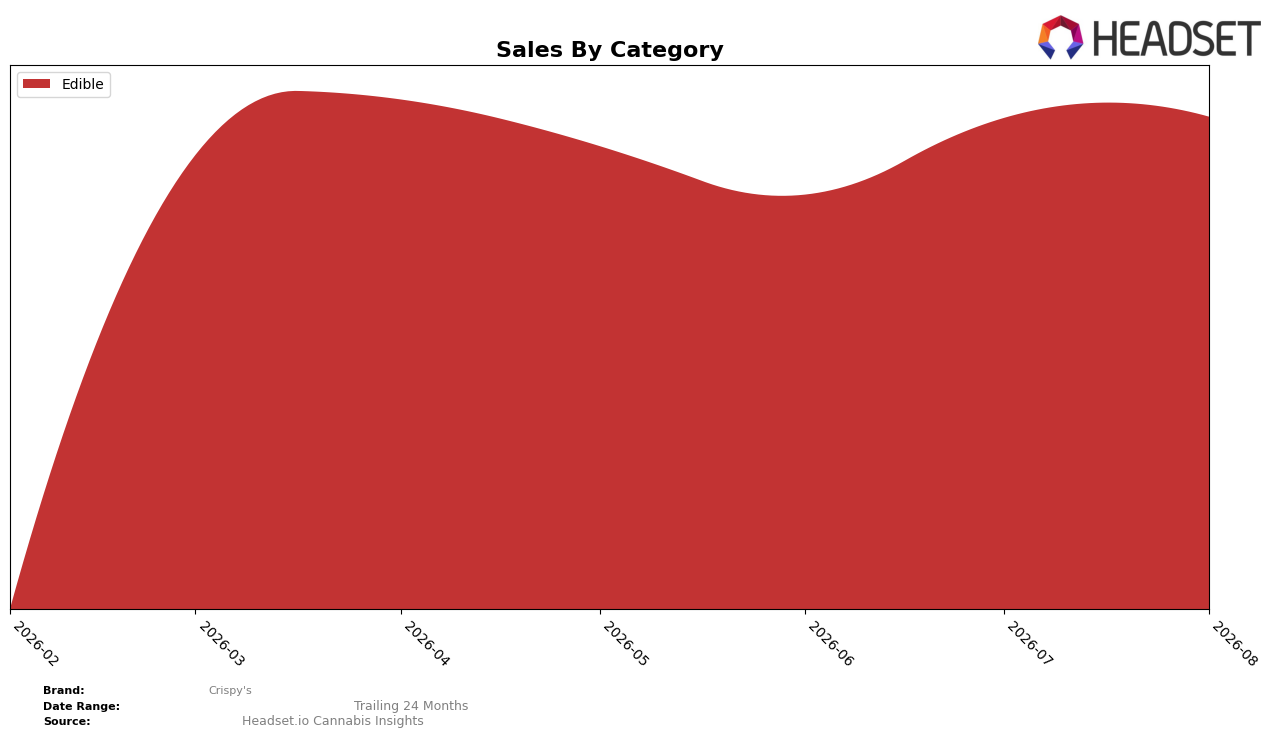
In August 2026, Crispy's operated as a single-category brand with Edible accounting for 100.0% of sales share, keeping category concentration unchanged at a full allocation while rank in Edible in New York sat at 33. Month over month, Edible sales rose by 26.4% while average price held at $24.13, and the absence of year-over-year data alongside a 100.0% mix signals limited diversification and measurement tethered to one demand stream. The pattern implies Crispy's is capturing short-cycle demand within Edibles but remains exposed to category-specific volatility given a 100.0% share in a single lane and a mid-pack rank of 33.
Positionally, a 26.4% MoM gain paired with a 100.0% Edible mix suggests Crispy's momentum is tied to tactical assortment or promotional timing rather than cross-category pull, with a rank of 33 indicating headroom for differentiation inside Edibles. With pricing steady at $24.13 and zero mix outside Edibles (0.0% in every other category), the brand trades depth for breadth, which implies a need to lean into segment niches where incremental share can move rank multiple positions or, alternatively, introduce even a 5–10% mix outside Edibles to reduce sensitivity to single-category swings.
Competitive Landscape
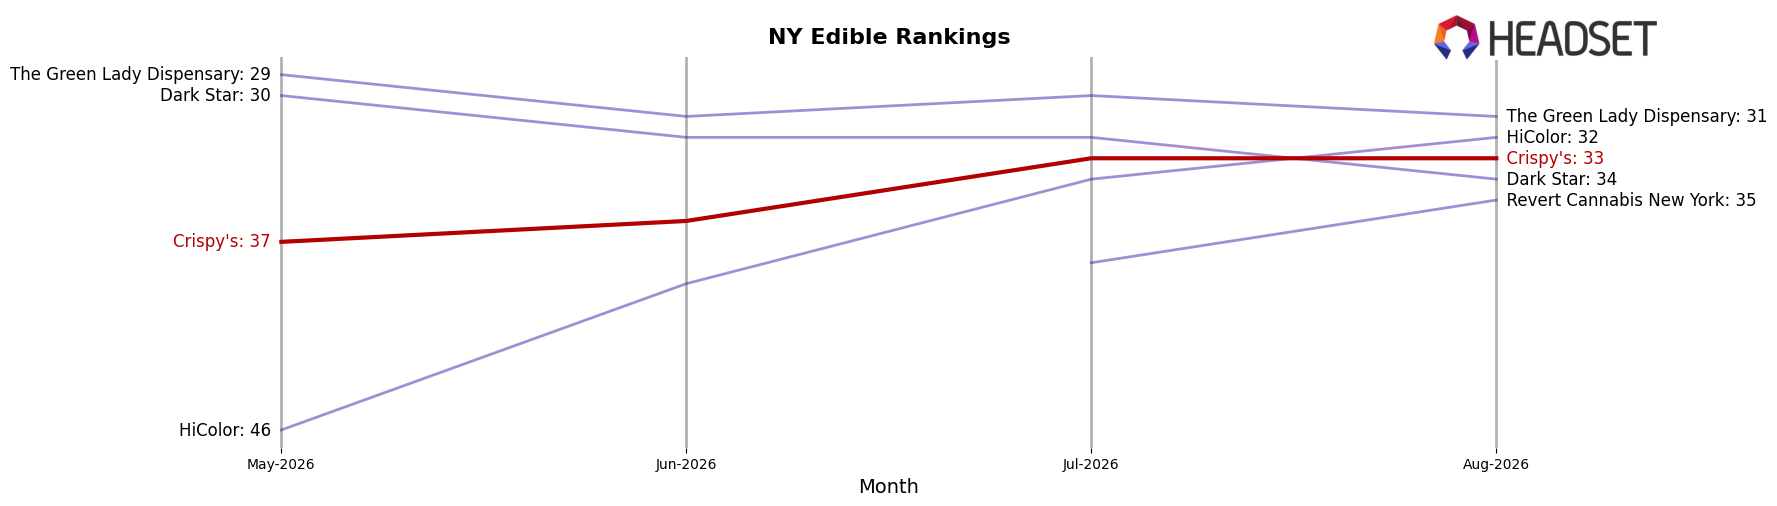
Crispy's sits at rank #33 in NY Edible, with a year-over-year rank change unavailable and a three-month move from #37 to #33 indicating a 4-position climb; August 2026 marks its peak rank at #33 while the category leaders are concentrated in the top five. In contrast, Camino advanced from #2 to #1 as of August 2026 with 10.5% YoY sales growth, while Off Hours slipped from #1 to #2 alongside a -24.8% YoY sales change, signaling volatility at the top as Crispy's edges upward from #37 to #33. This pattern implies Crispy's incremental rank gains are tied to gradual share capture rather than category-wide lift, and sustaining movement beyond the low-30s will likely require faster velocity than the 4-position improvement seen since May 2026.
Notable Products
Birthday Cake Rice Marshmallow Treat Bar (100mg) posted the steepest decline in August 2026 at -17.5% and fell to rank 4, while Bedrock Marshmallow Crispy Cereal Bar 10-Pack (100mg) slid -3.3% yet held rank 1. Cookies & Cream Marshmallow Treat (100mg) advanced +15.6% and held rank 2, and Hangry Crispy Caramel Cereal Bar (100mg) gained +11.3% at rank 3, concentrating all top-four positions in Edible SKUs. With $19,900 anchored in the leading 10-Pack, the mix implies Crispy's is leaning into multi-serve and classic flavor profiles while phasing down niche variants that are losing share.
Top Selling Cannabis Brands






Data for this report comes from real-time sales reporting by participating cannabis retailers via their point-of-sale systems, which are linked up with Headset’s business intelligence software. Headset’s data is very reliable, as it comes digitally direct from our partner retailers. However, the potential does exist for misreporting in the instance of duplicates, incorrectly classified products, inaccurate entry of products into point-of-sale systems, or even simple human error at the point of purchase. Thus, there is a slight margin of error to consider. Brands listed on this page are ranked in the top twenty within the market and product category by total retail sales volume.

