.svg)



Where to Buy
Dee / Dee Thai is stocked at 194 licensed dispensaries across California and Michigan, 188 of them in California, with the deepest coverage in Los Angeles, Sacramento, Santa Ana, Oakland, and San Francisco. Search by ZIP code or city below to find the closest one, or filter by product type if you are after a specific format.
Market Insights Snapshot
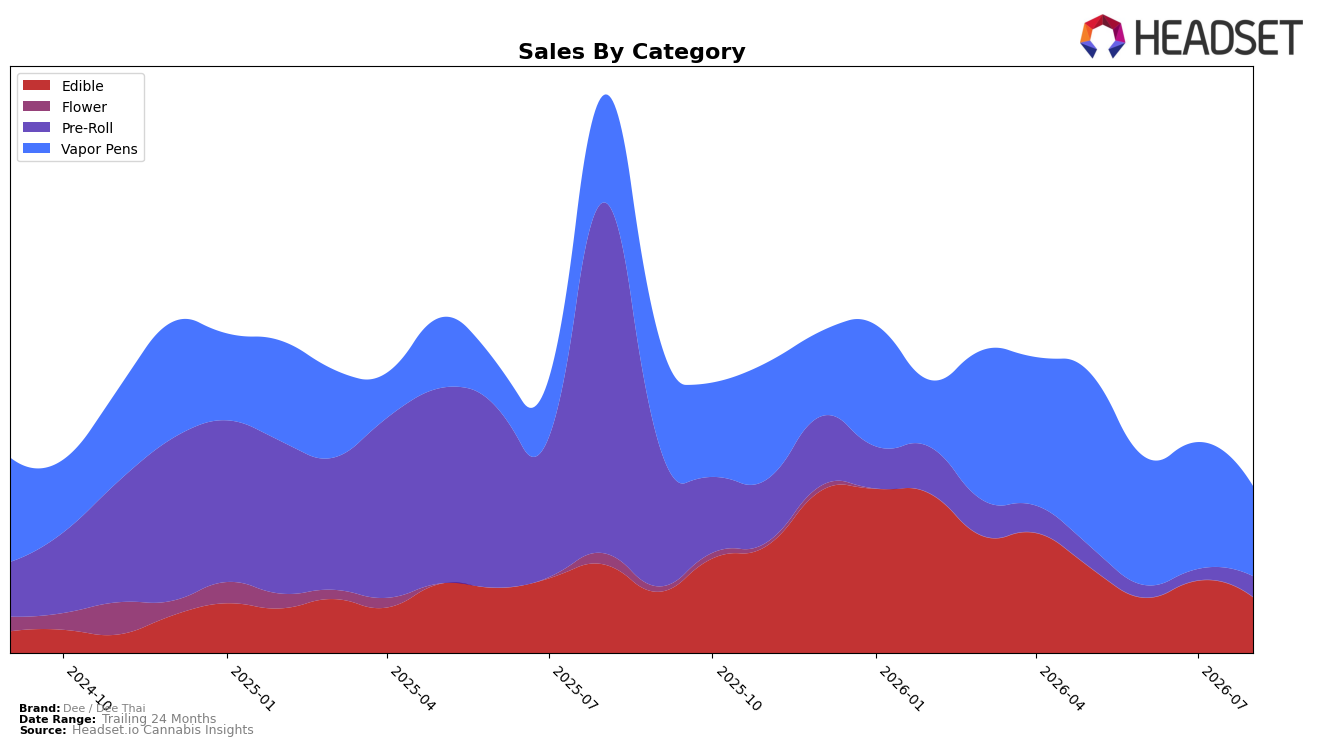
Dee / Dee Thai concentrated 54.11% of August 2026 sales in Vapor Pens and 33.55% in Edible, with Pre-Roll at 12.35%, but the mix shifted as Vapor Pens fell 29.03% month over month and 16.23% year over year while Edible declined 22.91% MoM and 37.12% YoY. The outlier was Pre-Roll, which surged 82.52% MoM despite a 94.16% YoY drop, indicating a small but rapidly expanding foothold within a shrinking base. With brand-wide sales down 70.22% YoY and average price down 10.11% YoY to $16.19, the pattern implies a pivot opportunity away from contracting Vapor Pens and Edible toward rebuilding a differentiated Pre-Roll position, especially given the brand’s concentration in California where the Edible rank sits at 50.
The mix and velocity shifts imply Dee / Dee Thai is overexposed to categories with sharper demand contraction while a niche rebound in Pre-Roll offers incremental share defense. Vapor Pens at 54.11% share with a 29.03% MoM slide and Edible at 33.55% share with a 22.91% MoM decline suggest the current assortment amplifies downside, whereas the 82.52% MoM lift in Pre-Roll alongside a 94.16% YoY trough indicates headroom for recovery if assortment and pricing migrate toward that pocket. Anchoring in California with an Edible category rank of 50 and a 37.12% YoY decline in Edible implies that near-term positioning should de-risk Edible exposure and reallocate toward faster-moving Pre-Roll formats while reassessing Vapor Pen price architecture relative to its 16.23% YoY contraction.
Competitive Landscape
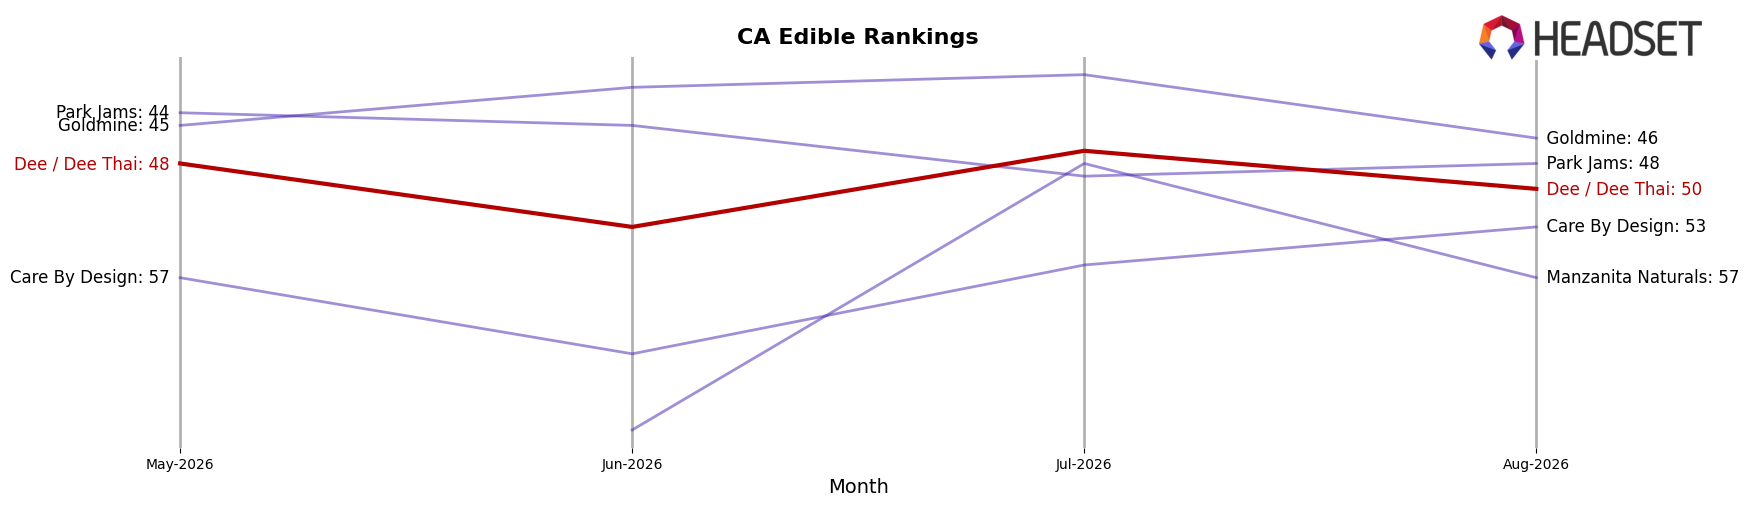
Dee / Dee Thai sits at rank #50 in CA Edible in August 2026, down 4 positions year over year from #46 and slipping 2 spots since May 2026 from #48, despite having peaked at #35 in February 2026. In contrast, Wyld held #1 year over year and in August 2026 while absorbing a -3.1% sales decline, and Camino maintained #2 with a 13.2% YoY sales increase, indicating that top-tier stability coincides with incremental share consolidation at the summit. The gap widened further as Kanha / Sunderstorm remained #3 with 6.8% YoY growth and Good Tide held #5 with 17.2% YoY growth, while Dee / Dee Thai’s downward rank drift from #46 to #50 and from #48 to #50 over the last three months points to a gradual loss of shelf velocity rather than a single-month shock, implying the brand’s February 2026 peak was not sustained and that recovery will require reversing multi-month share erosion.
Notable Products
CBG/THC 1:1 Refresh Guava Gummies 10-Pack (100mg CBG, 100mg THC) plunged 48.6% month over month and sat at rank 5, while CBD/THC 1:1 Restore Papaya Gummies 10-Pack (100mg THC, 100mg CBD) declined 15.7% at rank 3. In contrast, Mangosteen Rosin Gummies 10-Pack (100mg) climbed 25.1% to rank 2, creating a split where two of the top five Edible SKUs are moving in opposite directions. With four Edible SKUs in the top ten but mixed trajectories and Vapor Pens occupying ranks 4, 6, 7, and 9, the pattern implies Dee / Dee Thai is tilting assortment toward inhalables even as core gummies fragment between wellness ratios and fruit-forward rosin lines.
Top Selling Cannabis Brands






Data for this report comes from real-time sales reporting by participating cannabis retailers via their point-of-sale systems, which are linked up with Headset’s business intelligence software. Headset’s data is very reliable, as it comes digitally direct from our partner retailers. However, the potential does exist for misreporting in the instance of duplicates, incorrectly classified products, inaccurate entry of products into point-of-sale systems, or even simple human error at the point of purchase. Thus, there is a slight margin of error to consider. Brands listed on this page are ranked in the top twenty within the market and product category by total retail sales volume.

