.svg)
Aug-2026
Sales
Trend
6-Month
Product Count
SKUs
Avg Price
YoY Sales Change
YoY Price Change


Where to Buy
Double Baked is stocked at 79 licensed dispensaries across Massachusetts, with the deepest coverage in Boston, Haverhill, Springfield, Pittsfield, and Worcester. Search by ZIP code or city below to find the closest one.
Market Insights Snapshot
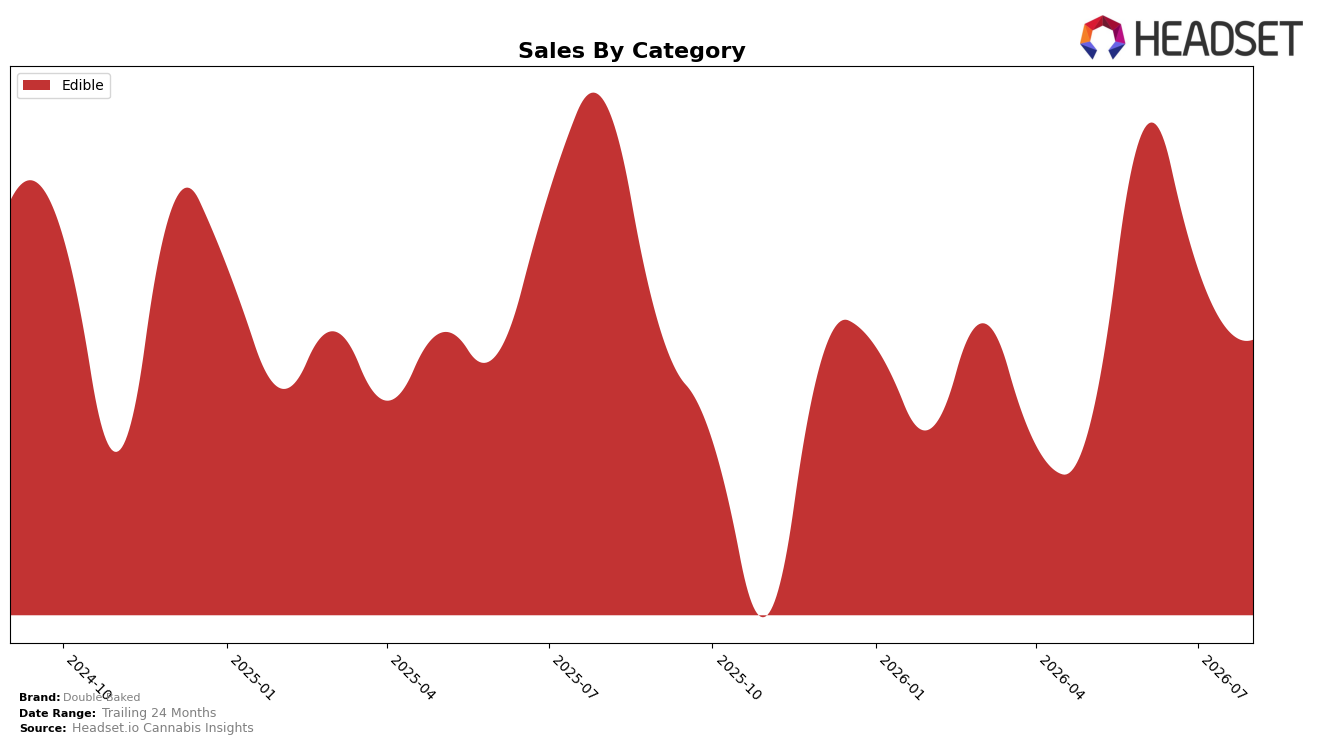
In August 2026, Double Baked was entirely concentrated in Edible, holding a 100.0% mix with year-over-year sales down 21.4% and month-over-month sales down 7.5%. Average price fell 30.0% YoY while the brand’s overall sales declined 21.4% YoY, indicating price contraction outpaced volume traction, and the 7.5% MoM dip alongside a 100.0% category concentration signals no offset from other categories. The brand ranked 43 in Edible in Massachusetts, and with MoM sales down 7.5% against a 30.0% YoY price drop, the rank position implies the current pricing stance is not converting into share gains. The pattern implies that a single-category footprint paired with accelerated price compression is eroding competitiveness without diversifying demand buffers.
The combination of a 100.0% mix in Edible and a 43 rank in Massachusetts, alongside a 30.0% YoY price decline and a 21.4% YoY sales decline, implies a value-led positioning that is not translating into higher rank or share capture. With sales falling 7.5% MoM despite materially lower prices, the elastic response is muted, indicating limited differentiation within Edible and overexposure to category-level discounting. The thesis is that Double Baked’s current price architecture and category concentration are pressuring perceived value, and without assortment expansion or premium-tier segmentation within Edible, the 43 position risks persistence even if prices stay 30.0% below last year.
Competitive Landscape
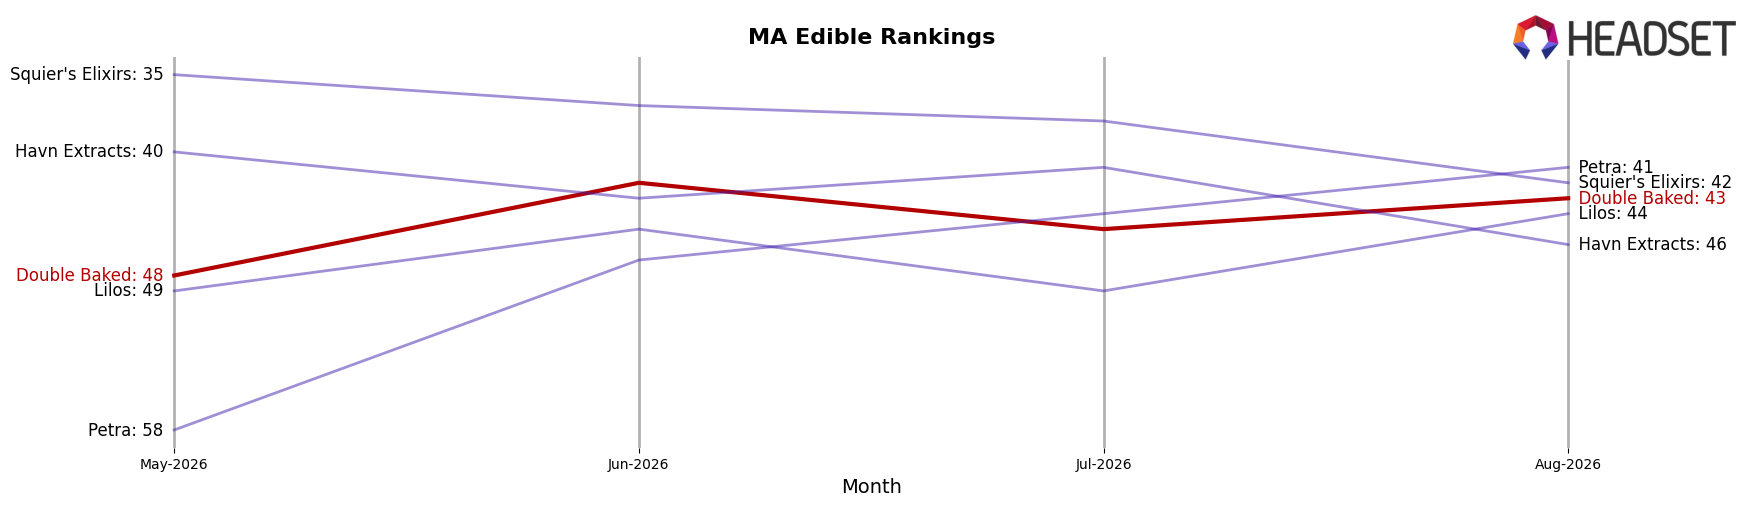
Double Baked sits at rank #43 in MA Edible for August 2026, slipping 2 positions year over year from #41 while improving 5 spots versus May 2026 when it was #48, indicating volatility rather than directional progress. At the top, Camino climbed from #5 to #1 with a 25.12% year-over-year sales increase, and Kanha / Sunderstorm held at #2 from #2 with a 4.75% sales lift, outpacing Double Baked’s rank movement in both stability and momentum. Wyld maintained #3 from #3 alongside an 8.16% sales gain, while Betty's Eddies stayed at #4 from #4 despite a 3.14% sales decline, underscoring that Double Baked’s 2-position YoY slide from its August 2025 peak at #41 comes amid leaders consolidating share. The pattern implies Double Baked’s trajectory is drifting toward the middle tier unless rank recovery from #48 three months ago to #43 converts into sustained gains against top-five peers.
Notable Products
Hybrid S'mores Cheesecake RSO Fast Acting Chocolates 20-Pack (100mg) posted the steepest movement in August 2026 with a -37.8% MoM drop while sliding to rank 2, contrasting with Sativa Cookies and Cream RSO Chocolates 20-Pack (100mg) up 45.5% MoM at rank 1. Indica Strawberry Cereal Crunch RSO Chocolates 20-Pack (100mg) gained 26.0% MoM at rank 4 while Sativa Fruity Cereal Milk RSO Chocolates 20-Pack (100mg) in rank 3 inched up 2.3% MoM, and six of the top ten are Edible chocolates signaling a concentrated format mix. The CBD/D9 1:1 Key Lime Pie Cheesecake Chocolate Bites 20-Pack (100mg CBD, 100mg THC) fell 31.7% MoM at rank 5 as Sativa Blueberry Cinnamon Streusel RSO Chocolate 20-Pack (100mg) dropped 38.8% MoM at rank 8, indicating flavor volatility within the same category despite Cookies and Cream carrying a $7,893 anchor. The pattern implies Double Baked is consolidating around a few hero chocolate SKUs with wide MoM dispersion, pointing to a need to double down on top flavors while pruning underperforming variants.
Top Selling Cannabis Brands






Data for this report comes from real-time sales reporting by participating cannabis retailers via their point-of-sale systems, which are linked up with Headset’s business intelligence software. Headset’s data is very reliable, as it comes digitally direct from our partner retailers. However, the potential does exist for misreporting in the instance of duplicates, incorrectly classified products, inaccurate entry of products into point-of-sale systems, or even simple human error at the point of purchase. Thus, there is a slight margin of error to consider. Brands listed on this page are ranked in the top twenty within the market and product category by total retail sales volume.

