.svg)

Sep-2026
Sales
Trend
6-Month
Product Count
SKUs
Avg Price
YoY Sales Change
YoY Price Change


Where to Buy
Cubits is stocked at 44 licensed dispensaries across Massachusetts, New Jersey, and Maine, 27 of them in Massachusetts, with the deepest coverage in Middleborough, Quincy, Allston, Amherst, and Ashby. Search by ZIP code or city below to find the closest one.
Market Insights Snapshot
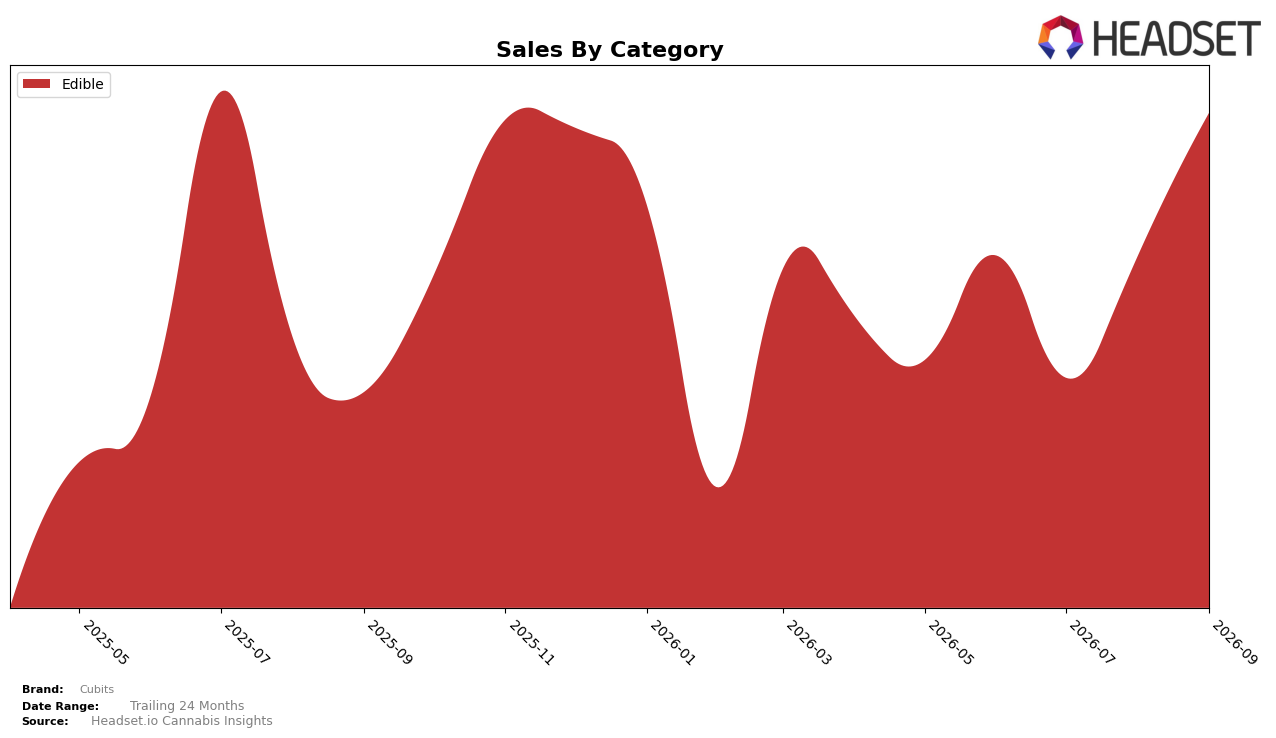
In September 2026, Cubits concentrated entirely in Edible, with category mix at 100.0% share and monthly acceleration of 30.7% MoM against an 83.6% YoY gain, while average price fell 23.5% YoY alongside a single-category focus that lifted unit velocity. With Massachusetts as the top state and Edible as the top category, the brand’s rank sits at 43, pairing mid-pack positioning with a steep YoY rise and a double-digit MoM lift; this pattern implies a volume-led expansion driven by lower pricing within a single-category footprint.
The combination of a 23.5% YoY price decline and 30.7% MoM sales growth in September 2026, on top of 83.6% YoY sales growth, indicates Cubits is trading price for share within Edible while relying on one-category scale economics. Holding rank 43 in Edible in Massachusetts alongside 100.0% category concentration suggests a tactical bet on depth over breadth; the implication is that near-term gains come from unit capture and basket penetration, but sustained advancement up the rankings will depend on either further price-optimized mix within Edible or selective adjacency tests to avoid plateauing at a mid-tier rank.
Competitive Landscape
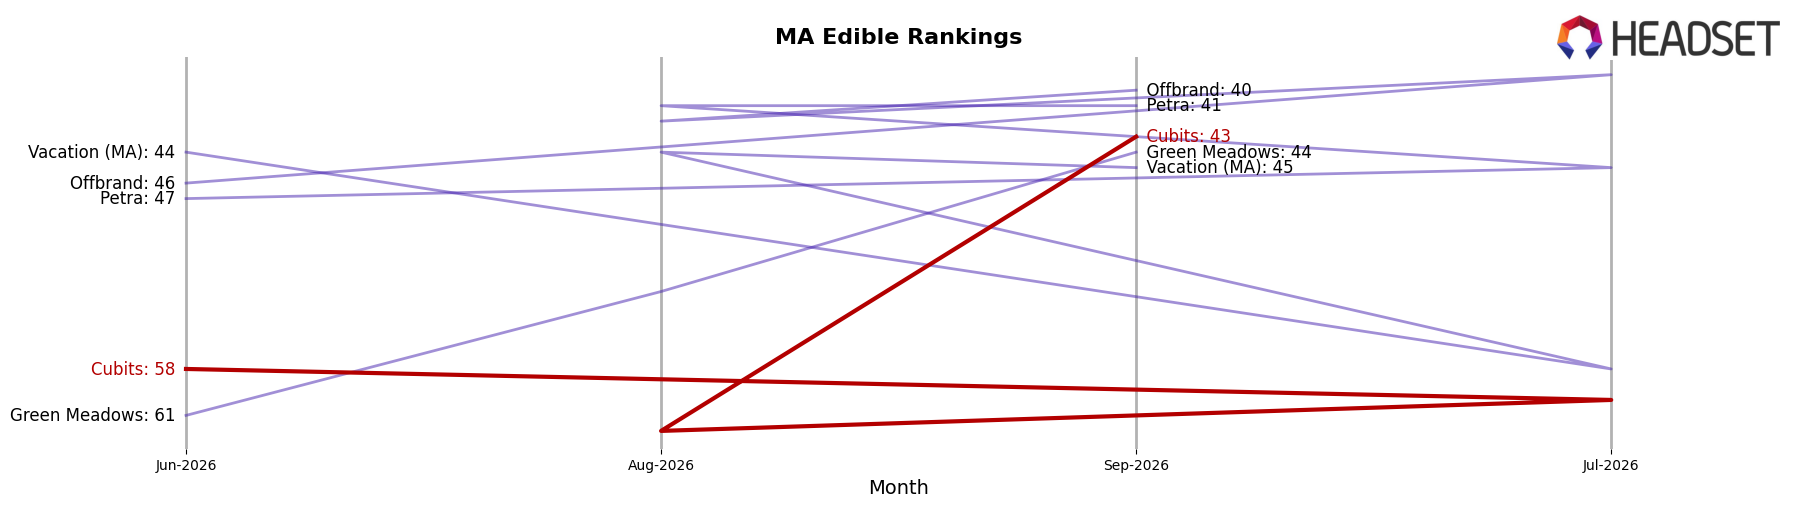
Cubits is ranked #43 in MA Edible in September 2026, improving 18 positions from #61 year over year and rising 15 spots from #58 since June 2026; this also matches its peak rank of #43 in September 2026, indicating a recent ceiling. In contrast, Camino climbed from #3 to #1 with 34.8% YoY sales growth while Kanha / Sunderstorm slipped from #1 to #2 despite 7.8% YoY growth, and Wyld moved up from #4 to #3 alongside 11.8% YoY growth, showing that category leadership is tightening at the top even as Cubits advances from the mid-pack. The pattern implies Cubits’ rapid rank gain is momentum-driven but still leaves a wide gap to the top tier, suggesting the brand is consolidating a foothold rather than converging with leaders in the near term.
Notable Products
Razmatazz Gummies 20-Pack (100mg) posted the largest month-over-month surge at +97.7% while holding rank 2, and Sour Key Limest Gummies 20-Pack (100mg) rose +80.4% to rank 1. In contrast, Granny Smith Gummies 20-Pack (100mg) declined -17.1% at rank 5 and Sour Blood Orange Gummies 20-Pack (100mg) slipped -8.2% at rank 4. With seven of the top ten SKUs concentrated in Edibles and two flavor leaders sitting in ranks 1–2, the mix points to Cubits accelerating flavor-driven gummy penetration rather than broadening into adjacent formats.
Top Selling Cannabis Brands






Data for this report comes from real-time sales reporting by participating cannabis retailers via their point-of-sale systems, which are linked up with Headset’s business intelligence software. Headset’s data is very reliable, as it comes digitally direct from our partner retailers. However, the potential does exist for misreporting in the instance of duplicates, incorrectly classified products, inaccurate entry of products into point-of-sale systems, or even simple human error at the point of purchase. Thus, there is a slight margin of error to consider. Brands listed on this page are ranked in the top twenty within the market and product category by total retail sales volume.

