.svg)
Jul-2026
Sales
Trend
6-Month
Product Count
SKUs
Avg Price
YoY Sales Change
YoY Price Change


Market Insights Snapshot
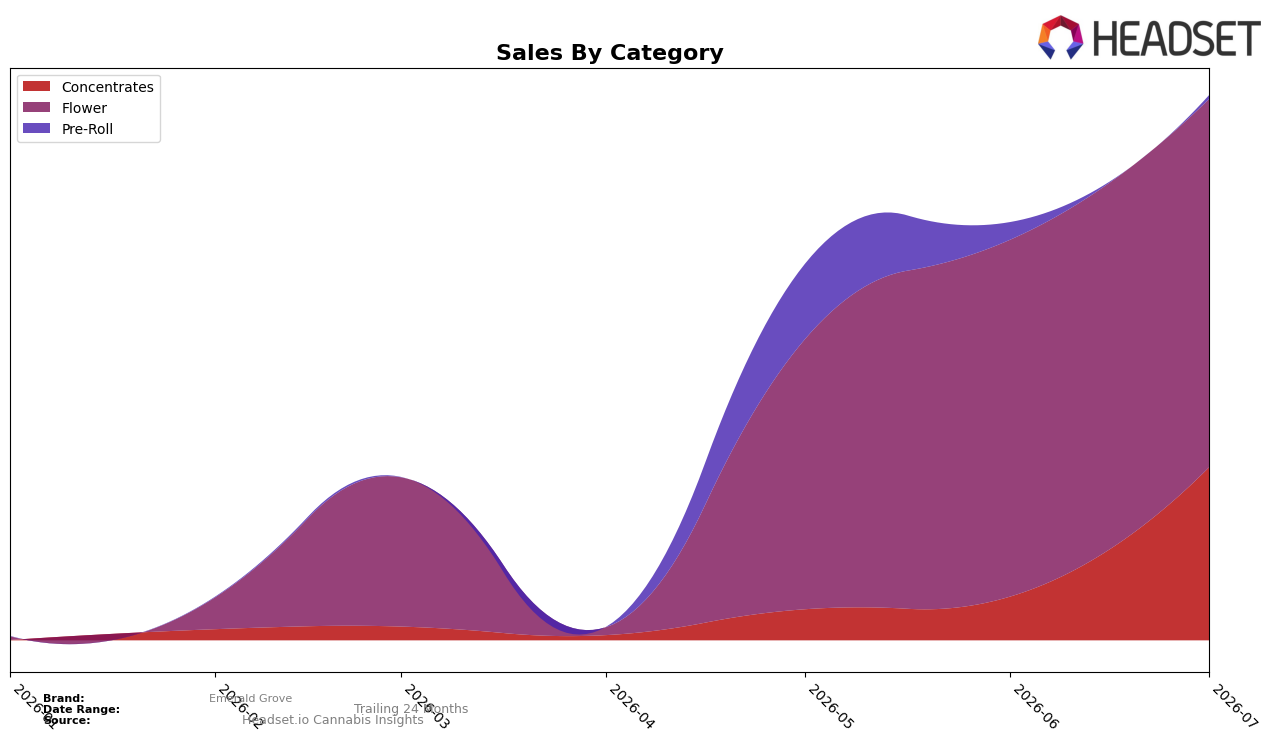
Emerald Grove’s category mix in July 2026 concentrated in Flower at 67.61% share with a month-over-month change of 3.19%, while Concentrates held 31.74% share with a 297.24% MoM surge, and Pre-Roll dropped to 0.66% share with a -79.31% MoM decline. The average price spread ranged from $4.21 in Pre-Roll to $20.07 in Concentrates, with Flower at 13.92, placing the overall average at $15.17. With Concentrates jumping nearly threefold MoM and Flower inching up low single digits, the pattern implies Emerald Grove is rapidly reallocating volume toward higher-priced extracts without fully abandoning its two-thirds Flower base.
Positioning in Massachusetts shows a dual-track strategy: a 297.24% MoM push in Concentrates against a 3.19% MoM lift in Flower suggests a pivot to premium potency formats while retaining a budget-accessible Flower anchor at 67.61% share. However, a rank of 49 in Concentrates within Massachusetts paired with only 0.66% share in Pre-Roll indicates the brand is using Concentrates for differentiation rather than scale, implying near-term gains will depend on sustaining extract velocity while preventing cannibalization of Flower’s majority share.
Competitive Landscape
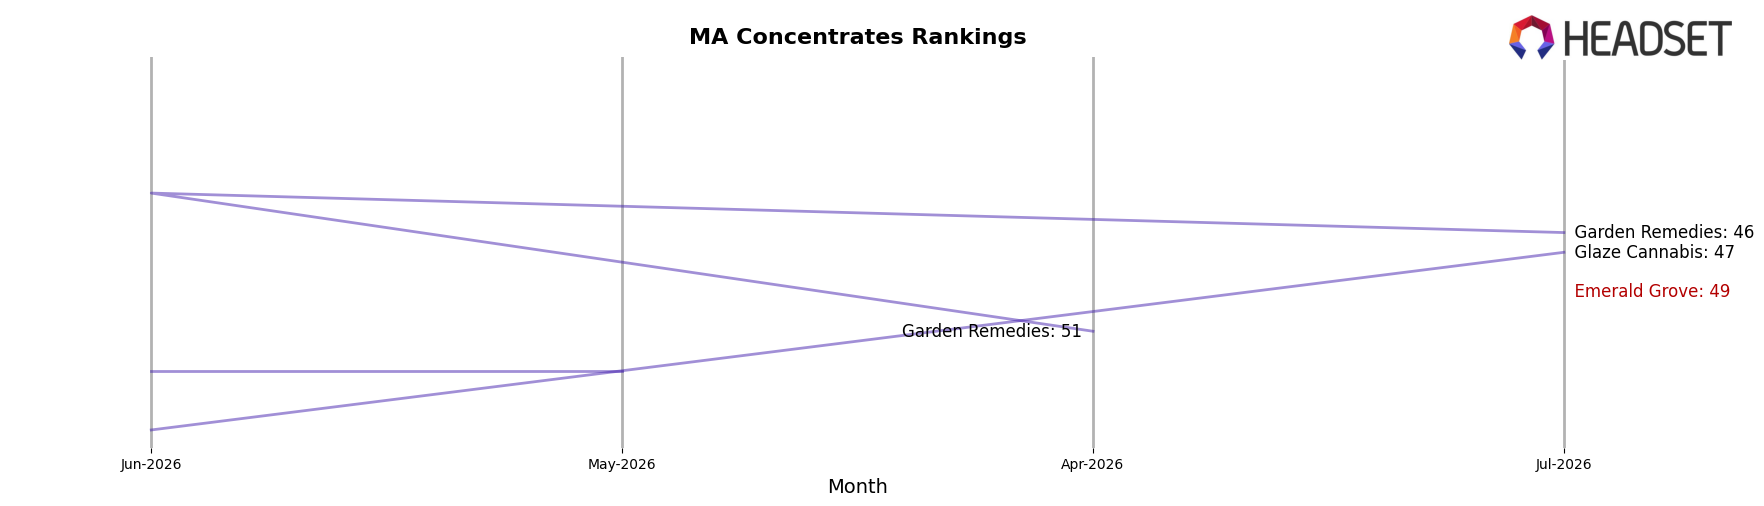
Emerald Grove sits at rank #50 in MA Concentrates in July 2026, reaching its peak position to date at #50 while climbing 54 places from #104 in April 2026; the quarter-on-quarter surge implies a step-change rather than noise despite the absence of a year-over-year rank baseline. Against that backdrop, Good Chemistry Nurseries held #1 with 81.5% year-over-year sales growth while Crispy Commission Concentrates stayed at #2 with a 21.5% YoY decline, indicating Emerald Grove’s late entry into the top 50 is occurring as the leader expands and the runner-up contracts. The pattern implies Emerald Grove’s rank trajectory is momentum-driven—catch-up from outside the top 100 towards mid-tier relevance—requiring sustained share gains to stick in a top-50 band where leaders are widening gaps and inconsistent performers create openings.
Notable Products
Green Crack Live Shatter (1g) delivered the headline move in July 2026 with a 599.9% month-over-month surge, vaulting into rank 4, while Northern Lights Pre-Roll (1g) fell 79.3% MoM to rank 9. Within Flower, Secret Meetings (3.5g) jumped 144.5% to rank 2 and Jelly Rancher (3.5g) advanced 112.2% to rank 1, even as Lemon Banana Sherbet (3.5g) slid 57.8% to rank 7. Concentrates accounted for four of the top ten SKUs, but Green Crack Cured Shatter (1g) dropped 51.6% at rank 10 alongside the Green Crack Live Shatter (1g) breakout, implying a shift toward live formats and high-velocity winners over legacy variants. The mix indicates Emerald Grove is tilting toward premiumized potency and freshness cues in Concentrates while doubling down on a narrowed set of Flower leaders to drive rank consolidation at the top.
Top Selling Cannabis Brands






Data for this report comes from real-time sales reporting by participating cannabis retailers via their point-of-sale systems, which are linked up with Headset’s business intelligence software. Headset’s data is very reliable, as it comes digitally direct from our partner retailers. However, the potential does exist for misreporting in the instance of duplicates, incorrectly classified products, inaccurate entry of products into point-of-sale systems, or even simple human error at the point of purchase. Thus, there is a slight margin of error to consider. Brands listed on this page are ranked in the top twenty within the market and product category by total retail sales volume.

