.svg)


Where to Buy
Growlytics is stocked at 10 licensed dispensaries across Colorado, with the deepest coverage in Denver, Aurora, Boulder, Commerce City, and Englewood. Search by ZIP code or city below to find the closest one.
Market Insights Snapshot
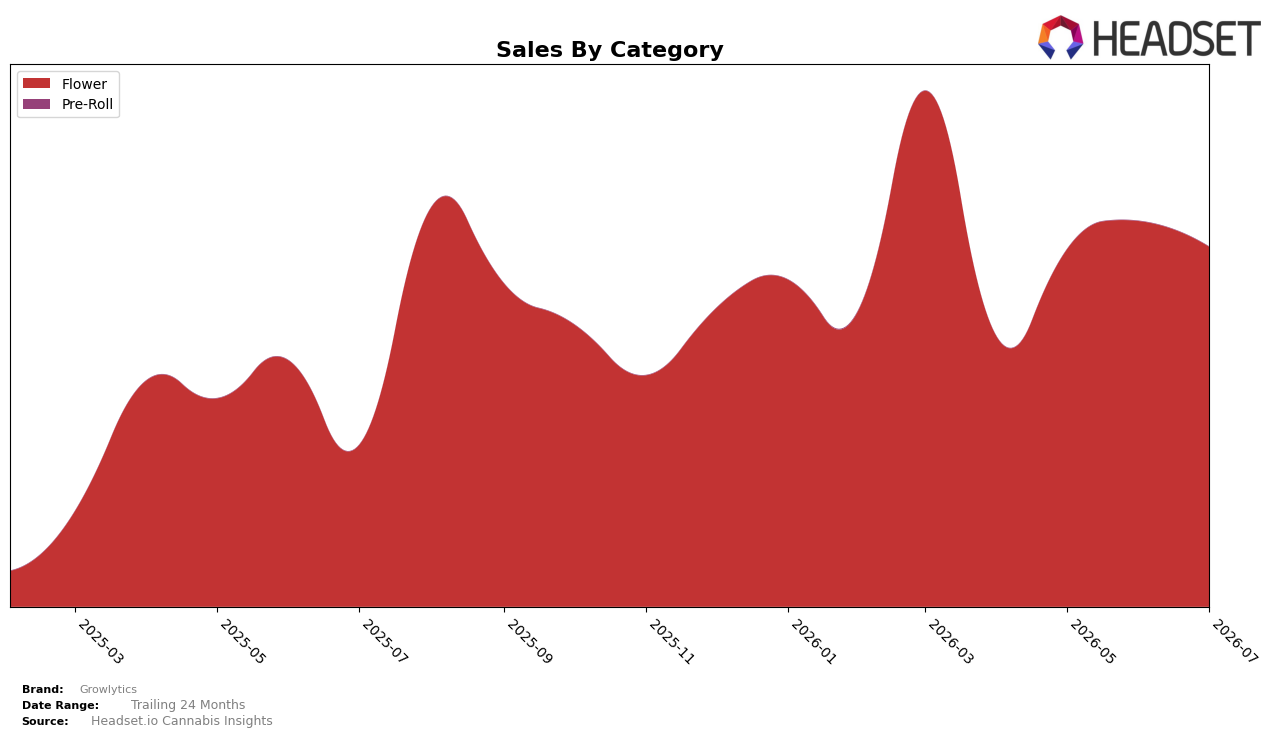
In July 2026, Growlytics concentrated entirely in Flower with a 100.0% category mix, pairing a 122.68% year-over-year sales increase with a -6.64% month-over-month decline, while average price rose 20.70% year over year. Within Colorado Flower, the brand held rank 48, indicating that despite triple-digit YoY momentum, current-month pullback and mid-pack placement define the operating baseline; the pattern implies reliance on a single category amplified pricing upside but introduced volatility risk tied to month-to-month swings.
The combination of a 20.70% YoY price increase and 122.68% YoY sales growth alongside a -6.64% MoM dip, while remaining at rank 48 in Colorado, implies that Growlytics is capturing demand elasticity in Flower but has yet to convert it into sustained rank advancement. The thesis is that a single-category footprint can scale quickly year over year yet cap near-term share gains when monthly sell-through softens, so preserving the July 2026 price premium without further MoM drag is pivotal for moving beyond rank 48 and stabilizing growth cadence.
Competitive Landscape
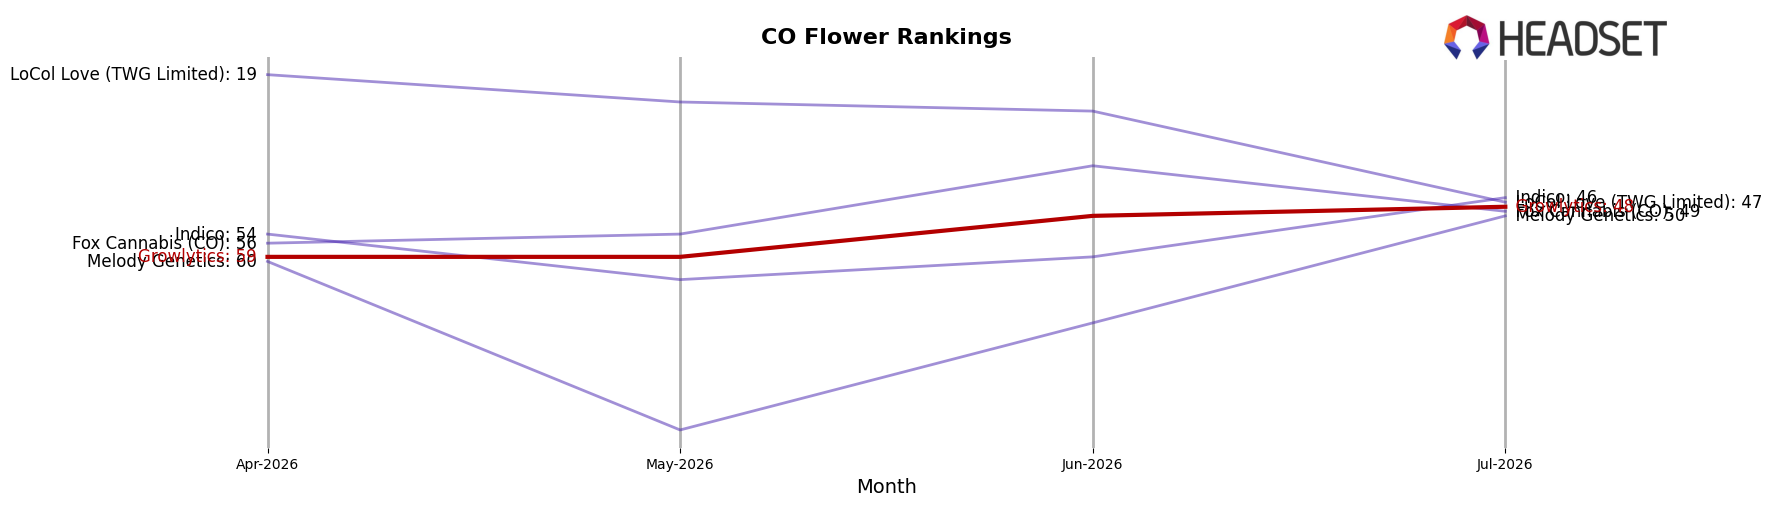
Growlytics sits at rank #48 in Colorado Flower for July 2026, improving 37 positions year over year from #85 while moving up 11 spots since April 2026 from #59, and its best month of March 2026 peaked at #44 before slipping back four places. In contrast, Seed & Strain Cannabis Co. advanced from #2 to #1 with 76.2% YoY sales growth, and Natty Rems surged from #23 to #5 on 168.5% YoY sales growth, while Good Chemistry Nurseries declined from #1 to #3 amid an 8.7% YoY sales contraction; this mix of upward and downward moves implies Growlytics’ rank recovery is real but not yet durable given its slide from its March 2026 peak and the sharper ascendancy among top rivals.
Notable Products
Oreo Blizzard (3.5g) posted the largest movement in July 2026 with a 130.9% month-over-month surge to rank 3, while Super Soldier Serum #3 (Bulk) fell 48.5% to rank 4, indicating share reallocation within the top tier. Oreo Blizzard (1g) also climbed 36.1% at rank 2, and Lemon Slam (3.5g) slipped 12.9% at rank 6, pointing to strength in value-sized upsell alongside weakness in mid-pack offerings. Four of the top ten are Flower SKUs from bulk formats, and Cherry Lime Haze (Bulk) cratered 78.7% at rank 9 even as Speak Easy (Bulk) led at rank 1 with $22,316, implying a pivot toward a few hero strains and sizes rather than broad bulk depth.
Top Selling Cannabis Brands






Data for this report comes from real-time sales reporting by participating cannabis retailers via their point-of-sale systems, which are linked up with Headset’s business intelligence software. Headset’s data is very reliable, as it comes digitally direct from our partner retailers. However, the potential does exist for misreporting in the instance of duplicates, incorrectly classified products, inaccurate entry of products into point-of-sale systems, or even simple human error at the point of purchase. Thus, there is a slight margin of error to consider. Brands listed on this page are ranked in the top twenty within the market and product category by total retail sales volume.

