.svg)


Market Insights Snapshot
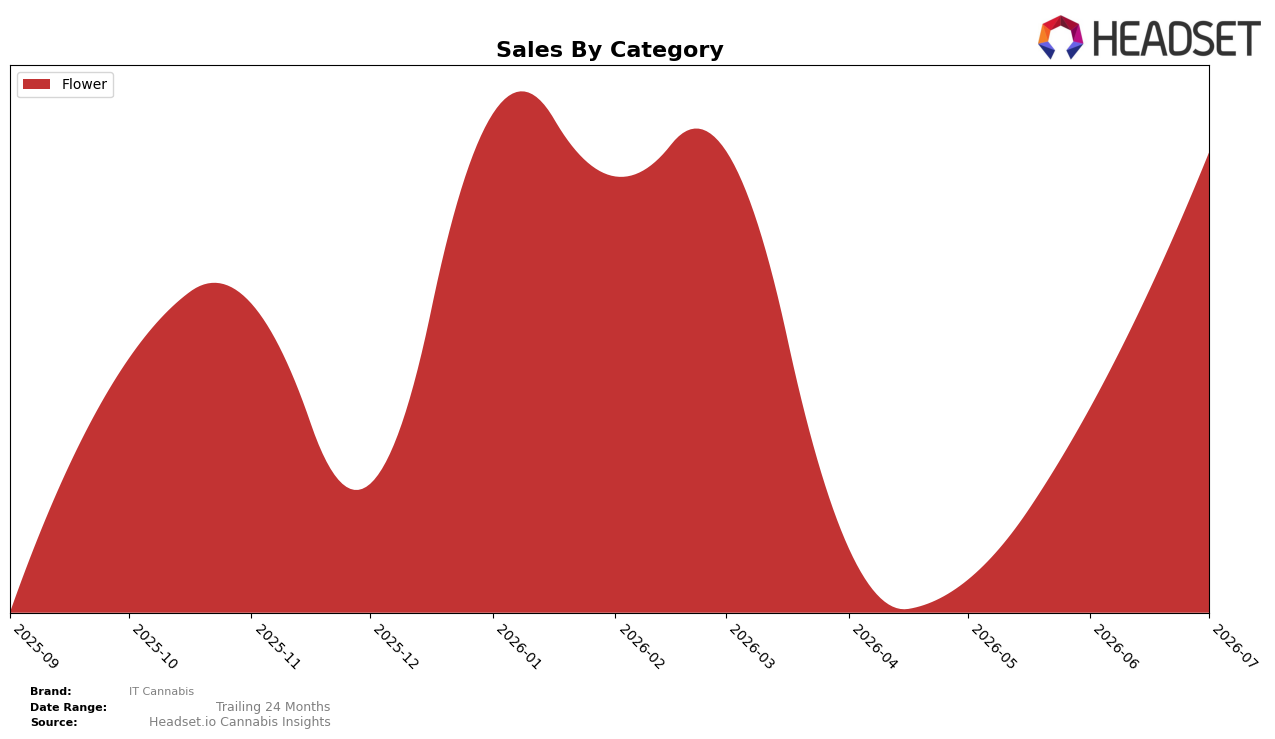
In July 2026, IT Cannabis operated as a single-category brand with Flower accounting for 100.0% of sales share and an average price of $28.92, while month-over-month sales in Flower climbed 119.10% from June 2026 and the brand held rank 42 in Colorado Flower. Year-over-year comparison is unavailable for Flower, but the complete concentration at 100.0% share paired with a triple‑digit MoM gain and a rank at 42 indicates volume acceleration concentrated in one lane rather than a diversified portfolio.
The 119.10% MoM surge in a category that is 100.0% of mix, combined with a rank of 42 in Colorado Flower, implies positioning that leans on rapid throughput over breadth, trading diversification risk for focus-driven gains. With the average price at $28.92 alongside a single-category footprint, the path forward likely depends on sustaining volume at rank 42 or climbing into the 30s, since any slip in Flower would transmit 100.0% of its impact to the brand; the thesis is that IT Cannabis is optimizing for depth in Flower now, which can build share quickly but leaves resilience contingent on maintaining the current MoM trajectory.
Competitive Landscape
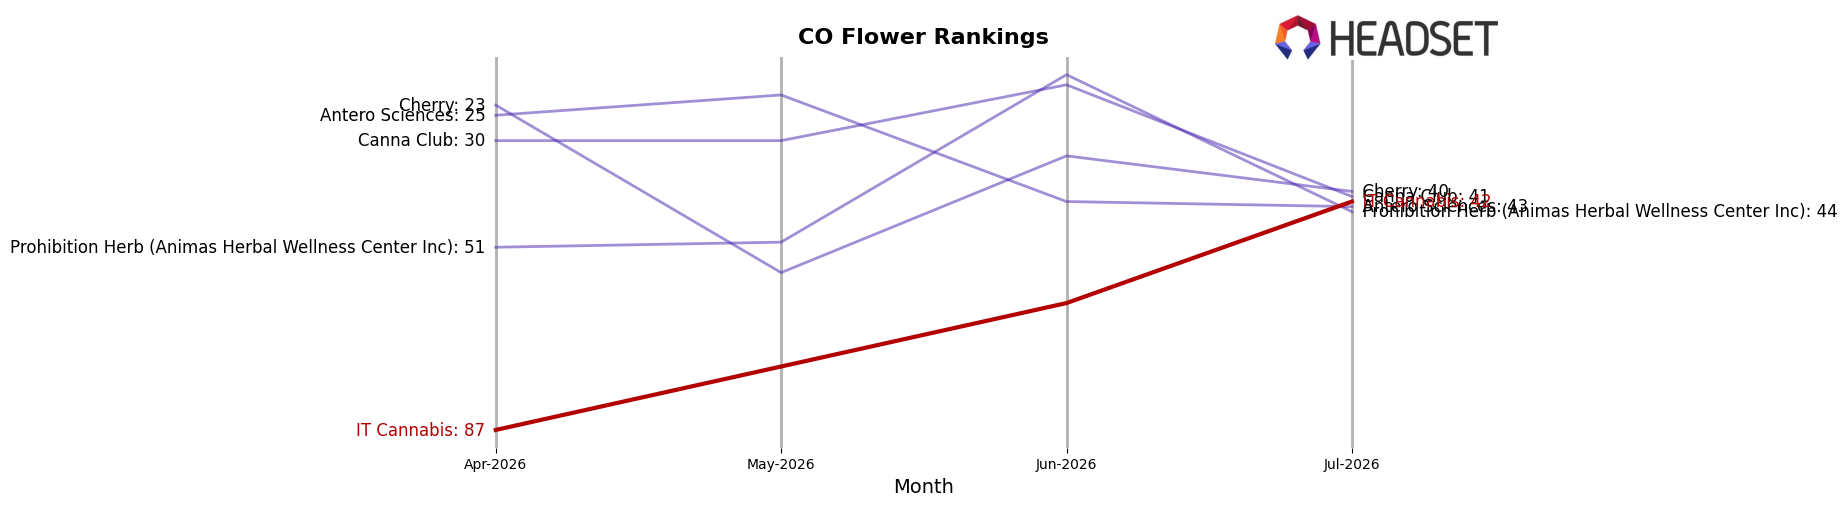
IT Cannabis sits at rank #42 in Colorado Flower in July 2026, up 45 positions from #87 in April 2026 and marking its peak rank to date at #42, while the lack of a year-over-year rank baseline limits direct YoY comparison but sets a new internal high-water mark; in contrast, Seed & Strain Cannabis Co. holds #1 with a +1 climb from #2 year-over-year and 76.23% YoY sales growth, and Good Chemistry Nurseries slid from #1 to #3 with an 8.70% YoY sales decline, indicating that IT Cannabis’s sharp quarter-on-quarter rank acceleration alongside turbulence among top-three incumbents creates an opening for further share capture if it sustains momentum.
Notable Products
Citradelic Sunset (Bulk) delivered the headline move in July 2026 with a +280.9% month-over-month surge that pushed it to rank 4, while Diablo's Dome (Bulk) fell -65.1% month over month to rank 10. The top three ranks were occupied by Sunset Sherbert (Bulk) at rank 1 and Tribe Walker (Bulk) at rank 2 alongside Rainbow Zoap (Bulk) at rank 3, indicating stability at the top despite a -65.1% collapse at the bottom. The concentration is clear with ten of the top ten coming from the Flower category, and Tokyo Sunset (Bulk) added a +30.6% month-over-month lift to rank 9 as a smaller but directionally consistent mover. The pattern implies IT Cannabis is leaning into Flower depth where large tactical pushes can rapidly reshuffle mid-tier positions while the very top remains anchored by steady bulk SKUs.
Top Selling Cannabis Brands






Data for this report comes from real-time sales reporting by participating cannabis retailers via their point-of-sale systems, which are linked up with Headset’s business intelligence software. Headset’s data is very reliable, as it comes digitally direct from our partner retailers. However, the potential does exist for misreporting in the instance of duplicates, incorrectly classified products, inaccurate entry of products into point-of-sale systems, or even simple human error at the point of purchase. Thus, there is a slight margin of error to consider. Brands listed on this page are ranked in the top twenty within the market and product category by total retail sales volume.

