.svg)

Sep-2026
Sales
Trend
6-Month
Product Count
SKUs
Avg Price
YoY Sales Change
YoY Price Change


Where to Buy
Left Hand Labs is stocked at 40 licensed dispensaries across Oregon, with the deepest coverage in Portland, Eugene, Salem, Corvallis, and Bend. Search by ZIP code or city below to find the closest one, or filter by product type if you are after a specific format.
Market Insights Snapshot
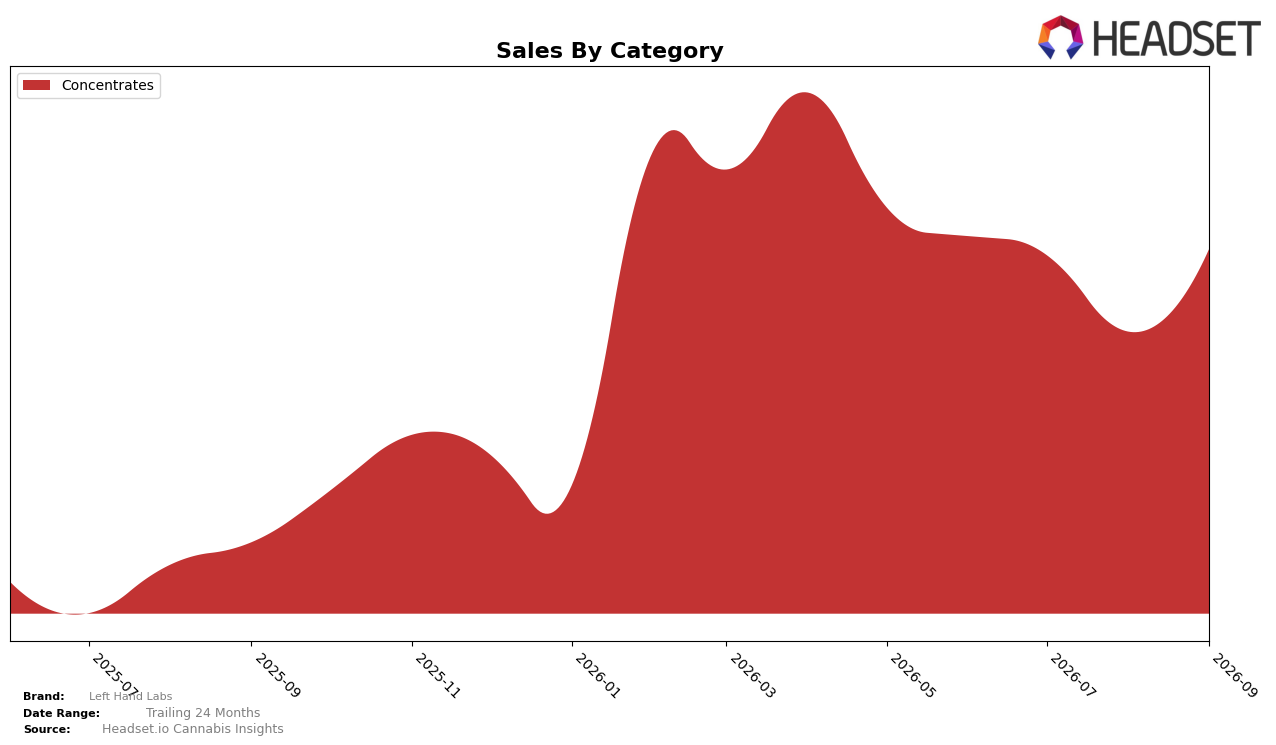
In September 2026, Left Hand Labs was entirely concentrated in Concentrates, with a 100.0% category share and a 26.78% month-over-month lift against a 295.13% year-over-year surge. Average price moved 4.66% higher year over year to $28.55 while the category’s sales expanded, indicating volume growth outpacing price. This pattern implies the brand is doubling down on a single-category strategy that is adding velocity rather than relying on pricing to drive gains.
Within Oregon Concentrates, the brand sat at rank 45 while posting 26.78% MoM growth and 295.13% YoY growth, a juxtaposition that pairs rapid expansion with mid-pack placement. With 100.0% of sales in Concentrates and a 4.66% YoY price uplift, the brand is leaning into value-to-volume tradeoffs that can climb rank positions if sustained, but the single-category exposure raises concentration risk if MoM momentum cools. The implication is a positioning centered on depth over breadth, where maintaining double-digit monthly growth and disciplined pricing becomes the lever to convert volume gains into rank improvement.
Competitive Landscape
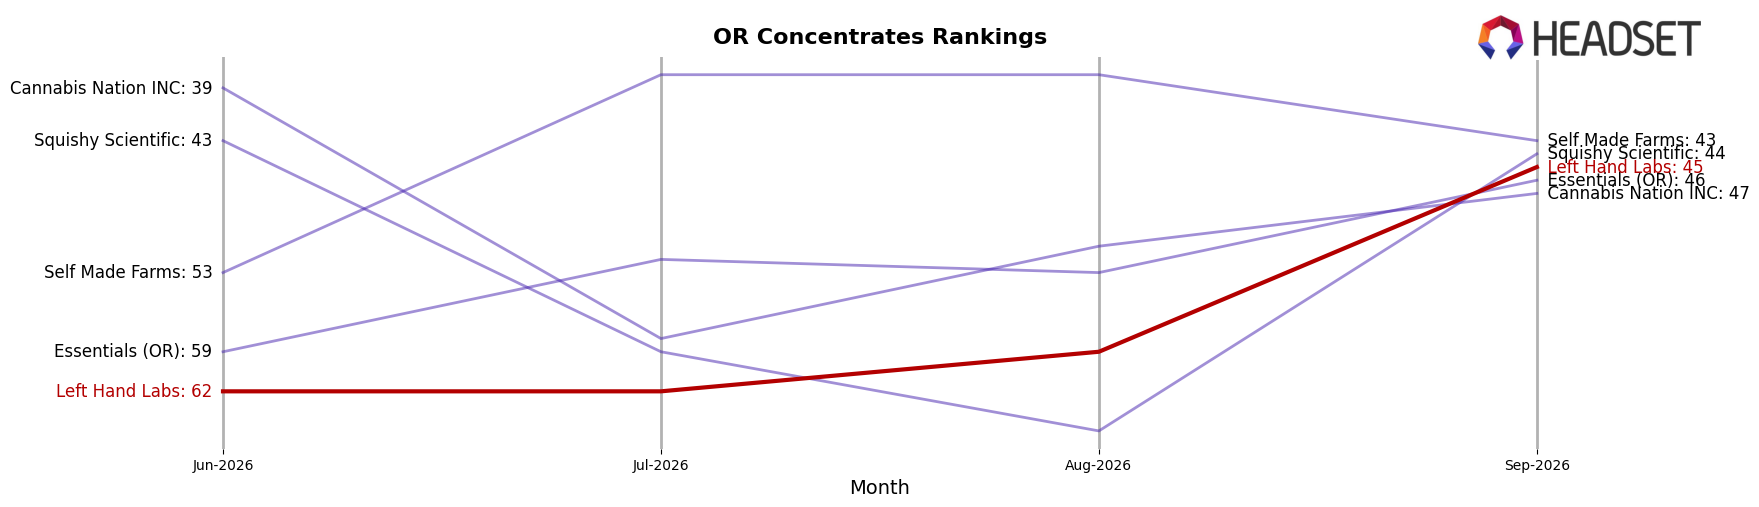
Left Hand Labs sits at rank #45 in OR Concentrates in September 2026, improving 59 positions from #104 year over year, and rising 17 spots from #62 in June 2026; this move coincides with a category top tier where Altered Alchemy held #1 both this year and last while growing sales 23.9%, and Oregrown advanced from #3 to #2 with 38.4% YoY growth, outpacing Red Eye Extracts (OR) which slipped from #2 to #3 as its sales declined 11.0%. With a new peak position at #45 in September 2026 and a three-month climb from #62, the pattern signals Left Hand Labs is moving from long-tail presence toward mid-pack relevance, but will need faster share gains than competitors advancing up the top five to convert rank momentum into durable placement.
Notable Products
Watermelon Key Lime Sour Bubble Hash (1g) led September 2026 with a 218.1% month-over-month surge into rank 4, while Honey Banana Cold Cure 70-140μ Live Rosin (1g) slipped 7.6% at rank 3, indicating volatility clustered around mid-tier positions. Grape Crepe #5 Cold Cure Hash Rosin (1g) climbed 84.0% to rank 5 as Sour Wilson Bubble Hash (1g) spiked 338.2% at rank 5, and Concentrates fully occupied the top ten, concentrating demand in a single category despite mixed momentum within it. Top-two placements by Sour D Cold Cure Hash Rosin (1g) at rank 1 and Tropic Sorbet Cold Cure Hash Rosin (1g) at rank 2, alongside Honey Banana Live Rosin (1g) up 112.6% at rank 5 and one product crossing $1,000 in sales, point to pull from premium rosin formats with selective upside for bubble hash. The pattern implies Left Hand Labs is tilting toward high-velocity rosin-led SKUs while using opportunistic bubble-hash spikes to expand share inside a category-heavy portfolio.
Top Selling Cannabis Brands






Data for this report comes from real-time sales reporting by participating cannabis retailers via their point-of-sale systems, which are linked up with Headset’s business intelligence software. Headset’s data is very reliable, as it comes digitally direct from our partner retailers. However, the potential does exist for misreporting in the instance of duplicates, incorrectly classified products, inaccurate entry of products into point-of-sale systems, or even simple human error at the point of purchase. Thus, there is a slight margin of error to consider. Brands listed on this page are ranked in the top twenty within the market and product category by total retail sales volume.

