.svg)

Sep-2026
Sales
Trend
6-Month
Product Count
SKUs
Avg Price
YoY Sales Change
YoY Price Change


Where to Buy
Shangri-La Farms (OR) is stocked at 25 licensed dispensaries across New York and Oregon, 13 of them in New York, with the deepest coverage in New York, Brooklyn, Farmingdale, Queens, and Setauket- East Setauket. Search by ZIP code or city below to find the closest one.
Market Insights Snapshot
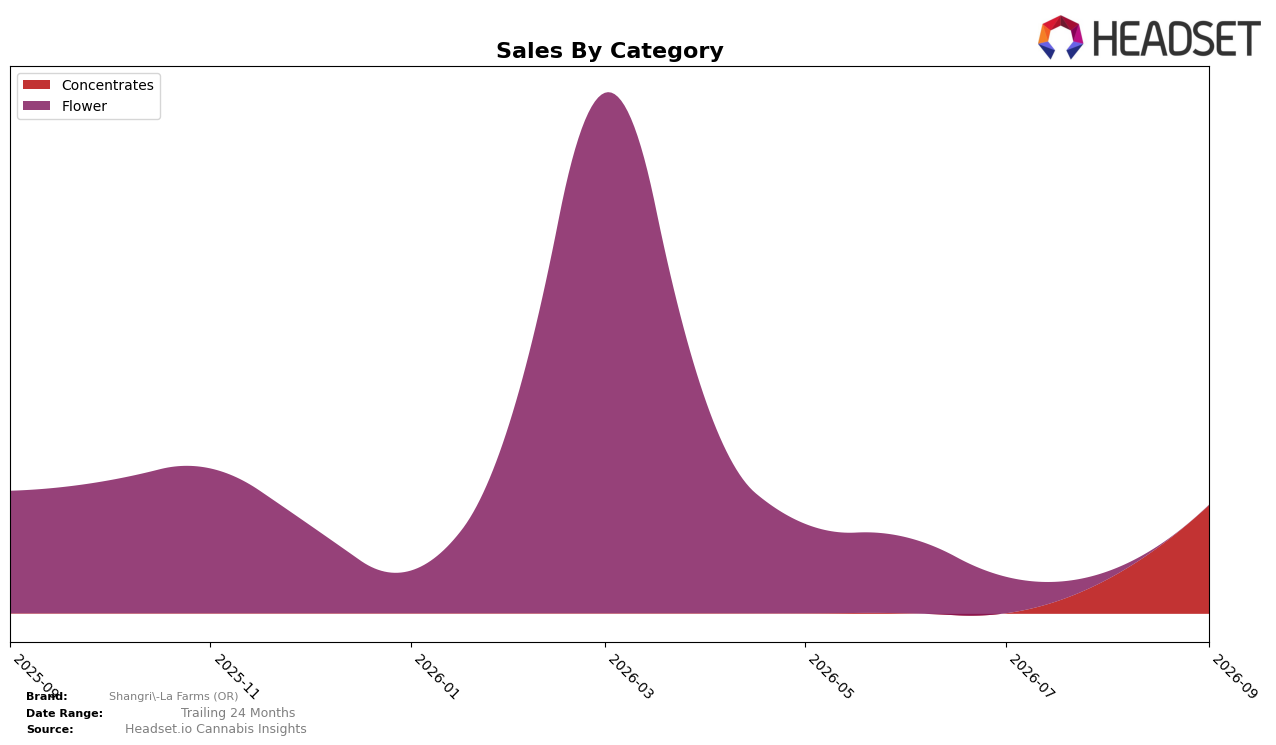
In September 2026, Shangri-La Farms (OR) operated as a single-category brand, with Concentrates accounting for 100.0% of sales and an average item price of $34.77. Despite category concentration, total brand sales declined 11.1% year over year while the average price rose 187.5% versus September 2025, indicating a steep mix shift within Concentrates toward higher-priced units or formats rather than broader category expansion. With no month-over-month or year-over-year category-mix diversification (Concentrates remained at a 100.0% share) and a state-category rank of 49 in Concentrates, the pattern implies volume contraction masked by price inflation within a single-channel exposure.
The combination of a 187.5% YoY price increase and an 11.1% YoY sales decline in September 2026 signals a positioning tilt toward premiumized Concentrates that has not translated into rank gains, as the brand sits at rank 49 in Oregon Concentrates. With 100.0% of sales in Concentrates and no observable MoM or YoY category breadth, this strategy implies higher reliance on fewer, costlier SKUs, elevating ticket size but likely suppressing unit velocity; sustaining or improving the rank position will require either price recalibration to recover volume or targeted SKU architecture that preserves elevated price points while broadening appeal within Concentrates.
Competitive Landscape
Shangri-La Farms (OR) sits at rank #49 in Oregon Concentrates in September 2026, a new peak position that marks 0 places of movement versus any prior recorded month and indicates an entry or re-entry without a logged Year-over-Year rank delta. The current leaderboard is led by Altered Alchemy at #1 with a Year-over-Year sales change of 23.9%, while Oregrown is #2 after improving from #3 and growing sales by 38.4%, indicating that the top tier is consolidating faster than the lower ranks; by contrast, Red Eye Extracts (OR) slipped from #2 to #3 with an 11.0% sales contraction, showing volatility even near the top. With its peak rank only at #49 and no Year-over-Year rank change available, the implication is that Shangri-La Farms (OR) is entering the tracked set late while the leaders expand or reshuffle, so climbing will require outpacing a #1–#3 tier that is moving by 1–2 ranks per year and posting double-digit percentage swings.

Notable Products
Papaya Live Rosin (1g) leads September 2026 with a rank of 1 and $5,617 in sales, while Dirty Taxi Live Rosin (1g) sits at rank 2 and Zkittles Live Rosin (1g) also holds a rank of 1 in a parallel listing, indicating a tie scenario that concentrates share at the very top. With three Concentrates SKUs occupying ranks 1–3, the absence of any ranked Flower items signals at least a two-rank spread between Concentrates leaders and any Flower presence. The pattern implies Shangri-La Farms (OR) is consolidating around premium live rosin where rank density is highest, tilting assortment and merchandising toward Concentrates over Flower in September 2026.
Top Selling Cannabis Brands






Data for this report comes from real-time sales reporting by participating cannabis retailers via their point-of-sale systems, which are linked up with Headset’s business intelligence software. Headset’s data is very reliable, as it comes digitally direct from our partner retailers. However, the potential does exist for misreporting in the instance of duplicates, incorrectly classified products, inaccurate entry of products into point-of-sale systems, or even simple human error at the point of purchase. Thus, there is a slight margin of error to consider. Brands listed on this page are ranked in the top twenty within the market and product category by total retail sales volume.

