.svg)
Jul-2026
Sales
Trend
6-Month
Product Count
SKUs
Avg Price
YoY Sales Change
YoY Price Change


Where to Buy
Essentials (OR) is stocked at 41 licensed dispensaries across Washington, New Jersey, and 5 other states, 17 of them in Washington, with the deepest coverage in Seattle, Ellensburg, Mount Vernon, Everett, and Kelso. Search by ZIP code or city below to find the closest one, or filter by product type if you are after a specific format.
Market Insights Snapshot
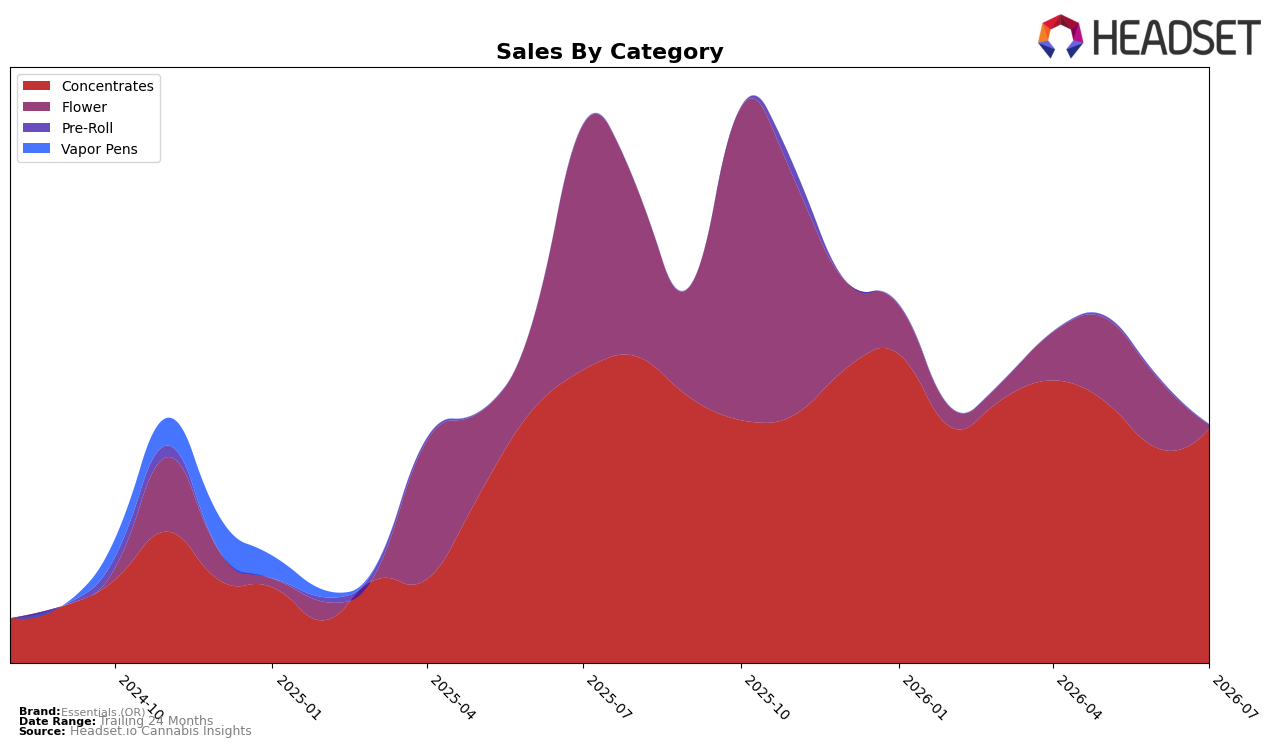
Essentials (OR) concentrated its July 2026 sales in Concentrates at 98.14% share while Flower fell to 1.86% share, indicating a sharpened mix despite a -55.74% brand sales year over year and a +472.78% lift versus 24 months. Within categories, Concentrates grew month over month by 8.98% but declined year over year by -20.17%, whereas Flower contracted both year over year by -98.19% and month over month by -93.65%. With an average price down -20.44% year over year to $13.54 alongside Concentrates’ 13.70 average price, the mix shift implies Essentials (OR) is leaning into price-accessible Concentrates to stabilize volume while exiting Flower exposure.
Positioning-wise, a 98.14% Concentrates mix paired with a rank of 45 in Oregon Concentrates sets a narrow competitive lane where month-over-month traction (+8.98%) must offset year-over-year contraction (-20.17%). The near-total retreat from Flower to 1.86% share, alongside a -98.19% year-over-year drop in that category, reduces cross-category insulation but simplifies pricing and assortment strategy as average price fell -20.44% while category share consolidated. The thesis is that Essentials (OR) is prioritizing depth over breadth in Concentrates to defend relevance at rank 45, trading category diversification for price-driven wins that can compound only if the month-over-month gains outpace the ongoing year-over-year drag.
Competitive Landscape
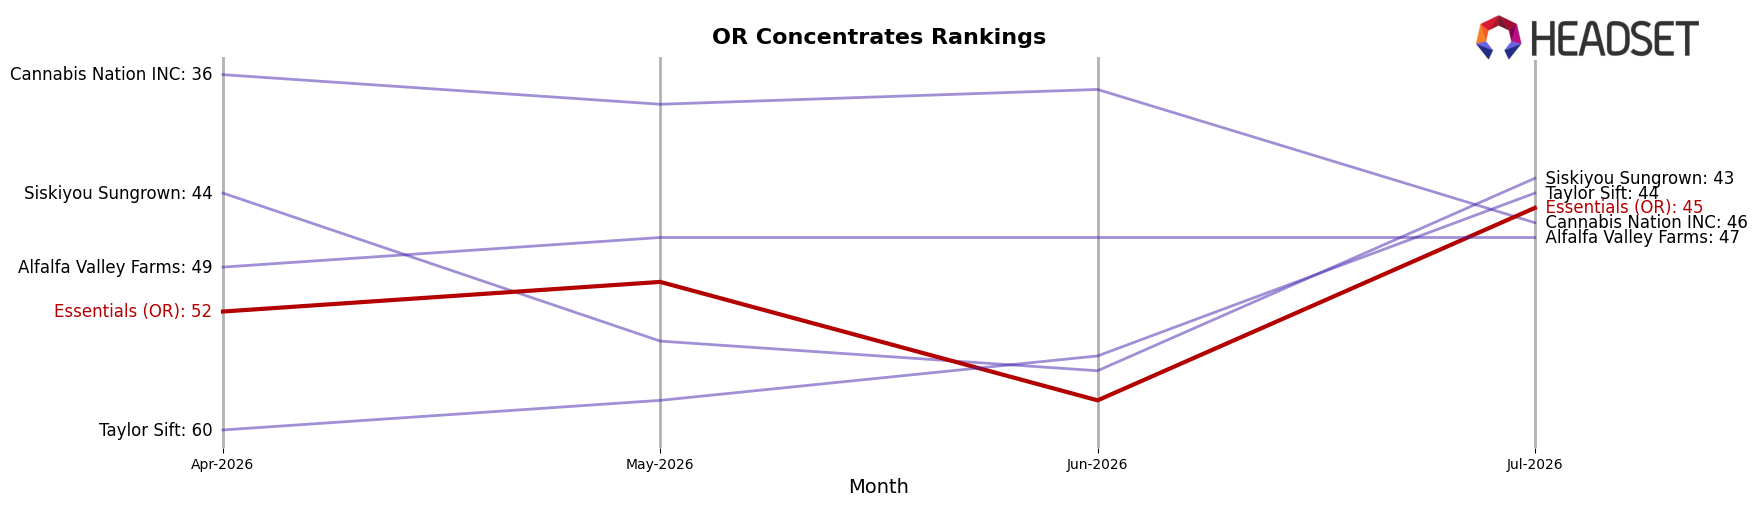
Essentials (OR) sits at rank #45 in OR Concentrates in July 2026, slipping 3 positions year over year from #42 while improving 7 spots since April 2026 when it was #52; against its history, the brand is 5 places off its peak at #40 from August 2025, indicating a gap that has not closed despite the recent quarter-on-quarter lift. Competitive pressure is intensifying at the top as Altered Alchemy held #1 year over year with a 19.5% sales increase, while Oregrown rose from #3 to #2 on 105.1% growth, outpacing Essentials (OR)’s rank trajectory in both direction and magnitude; meanwhile Buddies advanced from #9 to #4 with a 45.5% lift, a sharper climb than Essentials (OR)’s 7-rank three-month improvement. The pattern implies Essentials (OR) is recovering in the short term but losing relative position year over year, so without a shift toward top-tier velocity it risks being bracketed outside the top 40 as faster-rising competitors consolidate.
Notable Products
Pie Driver Diamonds and Sauce (2g) posted the steepest contraction at -56.2% MoM while sliding to rank 6, and Galactic Glue Diamonds and Sauce (2g) fell -49.0% MoM at rank 7, together marking a sharp pullback in the lower half of the top tier; by contrast, Jack Fruit Diamonds and Sauce (2g) rose +28.1% MoM to rank 2 with $2,899 in sales, indicating momentum is concentrated near the top while mid-pack SKUs retrench. Elephant Ears Diamonds and Sauce (2g) led at rank 1 with an implied flat-to-unknown MoM, and Blizzard King Diamonds and Sauce (2g) dropped -39.6% MoM to rank 3, so leadership is stable but volatile just beneath it; with all top ten positions occupied by Concentrates SKUs, the portfolio is tightly concentrated in one form factor, implying Essentials (OR) is trading depth for breadth and may be exposed to swings within a single category.
Top Selling Cannabis Brands






Data for this report comes from real-time sales reporting by participating cannabis retailers via their point-of-sale systems, which are linked up with Headset’s business intelligence software. Headset’s data is very reliable, as it comes digitally direct from our partner retailers. However, the potential does exist for misreporting in the instance of duplicates, incorrectly classified products, inaccurate entry of products into point-of-sale systems, or even simple human error at the point of purchase. Thus, there is a slight margin of error to consider. Brands listed on this page are ranked in the top twenty within the market and product category by total retail sales volume.

