.svg)
Aug-2026
Sales
Trend
6-Month
Product Count
SKUs
Avg Price
YoY Sales Change
YoY Price Change


Market Insights Snapshot
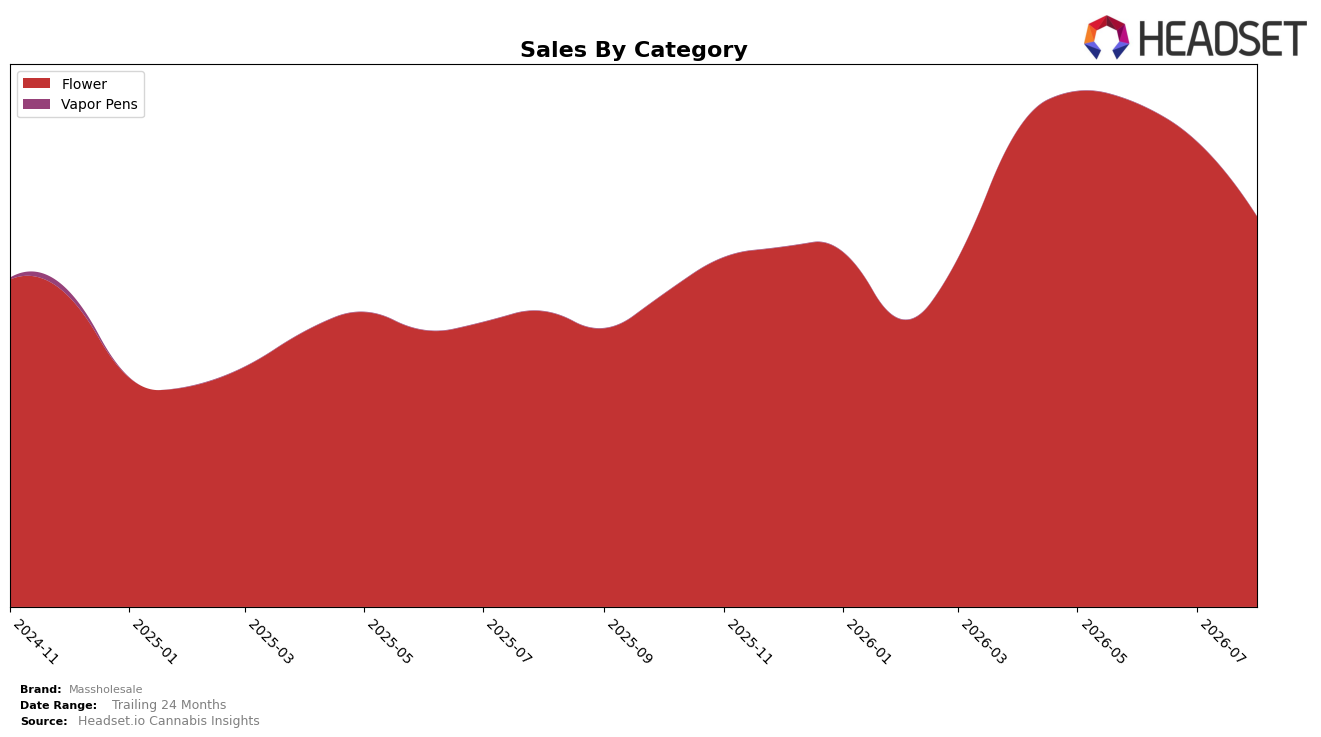
In August 2026, Massholesale operated as a single-category brand with Flower representing 100.0% of sales, up 32.0% year over year but down 16.2% month over month, while the average item price slipped 0.8% YoY to $95.20. Within the Flower context in Massachusetts, the brand held rank 46, indicating mid-pack placement despite the YoY sales gain; the combination of a 32.0% YoY lift alongside a 16.2% MoM pullback points to seasonal or promotional variance rather than broad-based mix expansion. The pattern implies reliance on a narrow portfolio that amplified volatility month to month, with rank 46 suggesting headroom for share capture if month-level swings can be stabilized.
The zero-diversification mix (100.0% Flower) coupled with a 16.2% MoM decline and rank 46 in Massachusetts implies exposure to Flower-specific demand cycles, even as a 32.0% YoY increase shows category fit at current price tiers. A 0.8% YoY price decrease alongside rising YoY sales indicates unit-driven growth rather than pricing power, and being at rank 46 signals that incremental gains will likely come from deeper penetration within Flower rather than price escalations. The thesis is that Massholesale’s positioning is anchored in Flower unit volume at stable-to-lower pricing, and without category diversification the brand’s share trajectory will depend on improving in-segment rank from 46 while smoothing MoM volatility.
Competitive Landscape
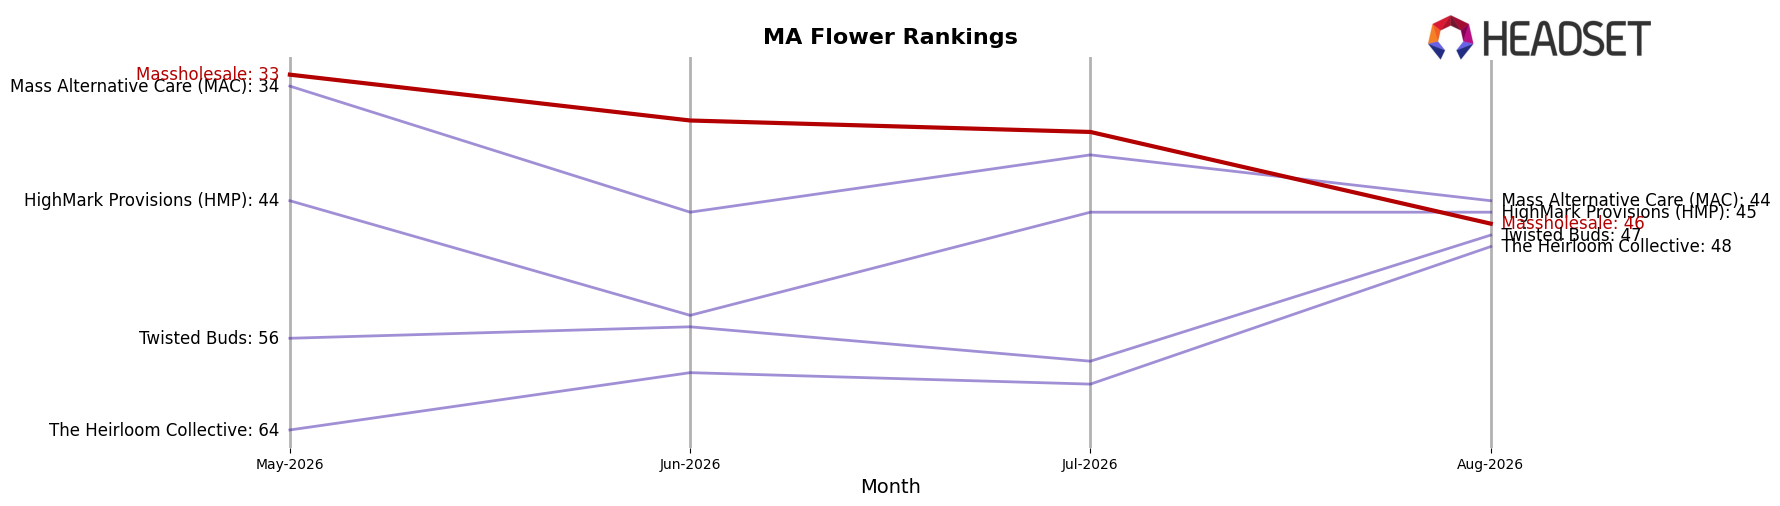
Massholesale sits at rank #46 in MA Flower for August 2026, improving 14 positions year over year from #60 but falling 13 spots since its three-month peak at #33 in May 2026; against this backdrop, Perpetual Harvest climbed from #4 to #1 with 51.76% YoY sales growth while Simply Herb slipped from #1 to #3 alongside a -6.24% YoY sales change, indicating that Massholesale’s partial YoY recovery coexists with recent momentum loss and implies a mid-tier position at risk of further erosion if the post-May slide continues.
Notable Products
Amaretto Mintz (28g) posted the standout move in August 2026 with a 99.7% month-over-month jump to rank 1, while J1 (28g) also accelerated 68.4% to rank 3, indicating a sharp tilt toward higher-velocity Flower SKUs. Sour Diesel (28g) held rank 2 without a reported MoM rate, and Cuban Linx (28g) in rank 7 rose 9.2%, while White Rainbow x Biscotti (28g) climbed 31.0% to rank 8, showing mid-pack momentum trailing the leaders. All ten top products are Flower, with multiple 28g SKUs clustered in ranks 1 through 10, concentrating assortment in large-format value that can sustain unit throughput. The pattern implies Massholesale is leaning into bulk Flower scale, prioritizing 28g velocity plays over breadth, which redirects commercial focus toward price-sensitive, repeat-purchase baskets rather than premium variety.
Top Selling Cannabis Brands






Data for this report comes from real-time sales reporting by participating cannabis retailers via their point-of-sale systems, which are linked up with Headset’s business intelligence software. Headset’s data is very reliable, as it comes digitally direct from our partner retailers. However, the potential does exist for misreporting in the instance of duplicates, incorrectly classified products, inaccurate entry of products into point-of-sale systems, or even simple human error at the point of purchase. Thus, there is a slight margin of error to consider. Brands listed on this page are ranked in the top twenty within the market and product category by total retail sales volume.

