.svg)



Where to Buy
Otto's is stocked at 40 licensed dispensaries across Oregon, with the deepest coverage in Portland, Eugene, Bend, Newport, and Ontario. Search by ZIP code or city below to find the closest one, or filter by product type if you are after a specific format.
Market Insights Snapshot
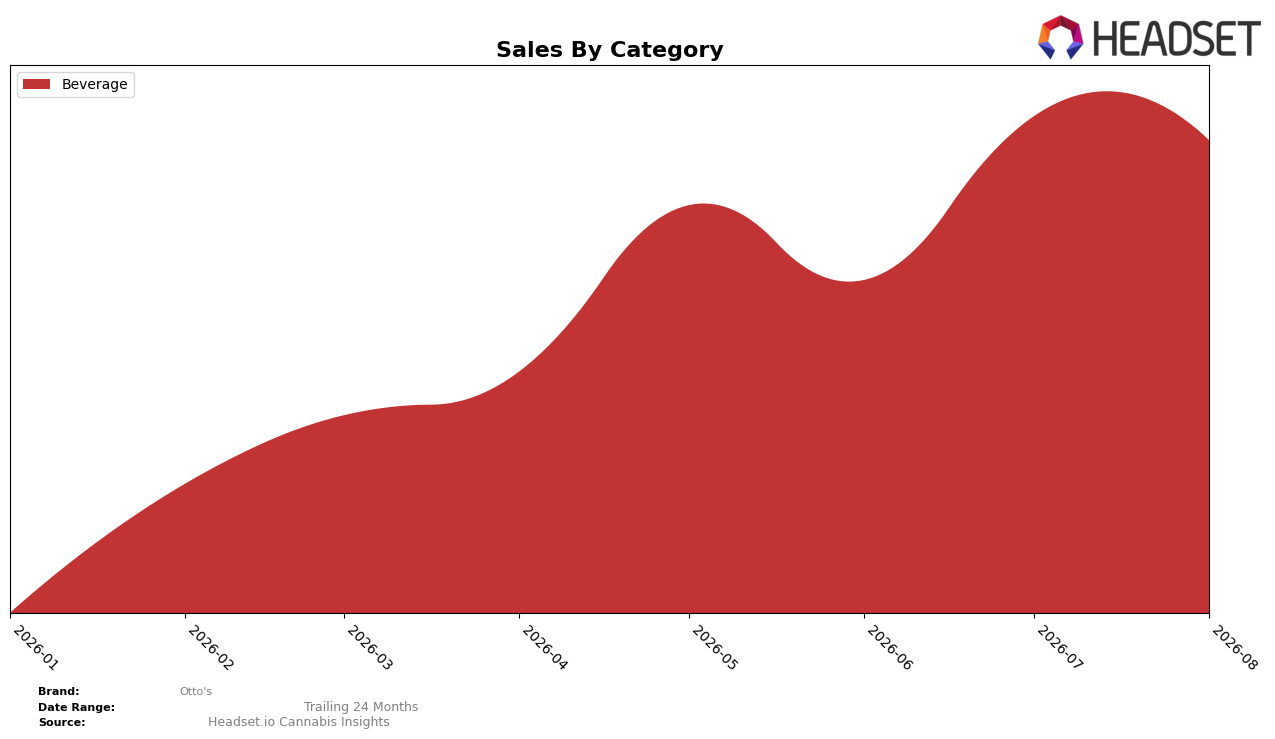
Otto's operated as a single-category brand in August 2026 with Beverage at 100.0% share, while month-over-month Beverage sales declined 2.31% and the brand held rank 9 in Oregon Beverage. With no year-over-year percentage reported for Beverage and a stable 100.0% mix, the notable movement is the 2.31% MoM dip alongside an average price of $4.56. The pattern implies a concentration risk: full reliance on Beverage means the 2.31% MoM contraction directly maps to overall performance, and maintaining rank 9 suggests share is contained within a narrow band rather than expanding to higher ranks.
The 100.0% category dependence paired with a 2.31% MoM downtick and a rank position of 9 indicates the brand’s positioning is volume-sensitive and price-levered at an average of $4.56. With no diversification offset and no YoY growth metric, a flat mix constrains trajectory while rank 9 caps visibility against peers in Oregon Beverage. The pattern implies Otto's must either raise its rank from 9 to a higher bracket or reduce MoM volatility from -2.31% to a steadier cadence to advance positioning within Oregon Beverage.
Competitive Landscape
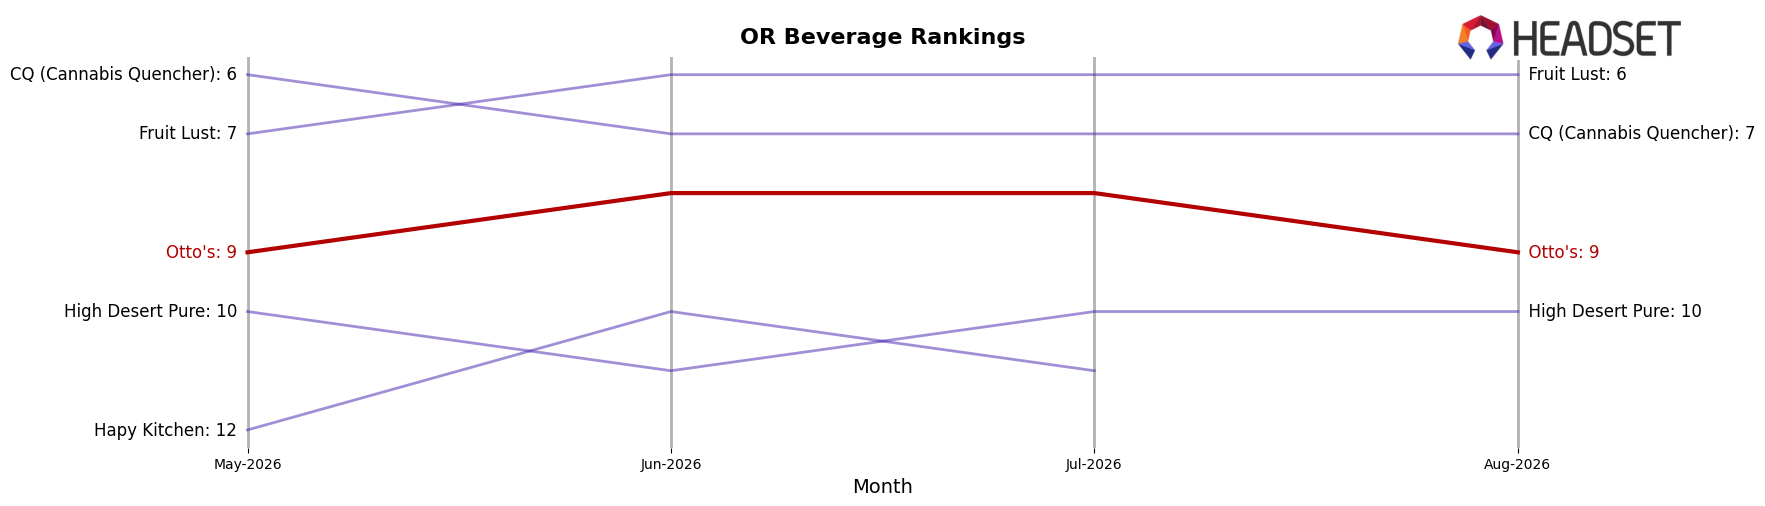
Otto's is ranked #9 in OR Beverage in August 2026, holding the same #9 position as in May 2026 and slipping 1 spot from its peak of #8 in July 2026; this stability contrasts with Magic Number at #1 with a year-over-year sales change of +23.7% and Keef Cola at #2 despite a -36.3% year-over-year sales change. Otto's flat three-month rank at #9 alongside Mule Extracts holding a current #3 versus #4 a year ago (a 1-place climb) indicates Otto's position is cushioned by competitor declines yet capped by a growing #1, implying the brand’s trajectory points to mid-tier persistence unless conversion gains move it more than 1–2 rank positions above its July 2026 peak.
Notable Products
Pineapple Passionfruit Sparkling Cider (10mg THC, 12oz, 355ml) posted the steepest decline at -16.9% month over month while sliding to rank 2, whereas Hopped Apple Infused Sparkling Cider (10mg THC, 12oz, 355ml) rose 12.2% MoM to rank 1. Pear Rhubarb Infused Sparkling Cider (10mg THC, 12oz, 355ml) held rank 3 with a -1.8% MoM dip, and two of the top three SKUs are showing negative MoM trends despite the category leader growing. The $9,850 result for Hopped Apple suggests mix is tilting toward a single hero SKU even as overall Beverage concentration (three of the top three are Beverage) heightens volatility risk. The pattern implies Otto's is consolidating demand around one flagship while second-tier flavors require repositioning to prevent share erosion.
Top Selling Cannabis Brands






Data for this report comes from real-time sales reporting by participating cannabis retailers via their point-of-sale systems, which are linked up with Headset’s business intelligence software. Headset’s data is very reliable, as it comes digitally direct from our partner retailers. However, the potential does exist for misreporting in the instance of duplicates, incorrectly classified products, inaccurate entry of products into point-of-sale systems, or even simple human error at the point of purchase. Thus, there is a slight margin of error to consider. Brands listed on this page are ranked in the top twenty within the market and product category by total retail sales volume.

