.svg)
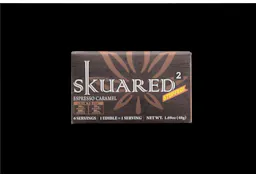


Where to Buy
Skuared is stocked at 72 licensed dispensaries across Washington, with the deepest coverage in Bellingham, Seattle, Spokane, Anacortes, and Bellevue. Search by ZIP code or city below to find the closest one.
Market Insights Snapshot
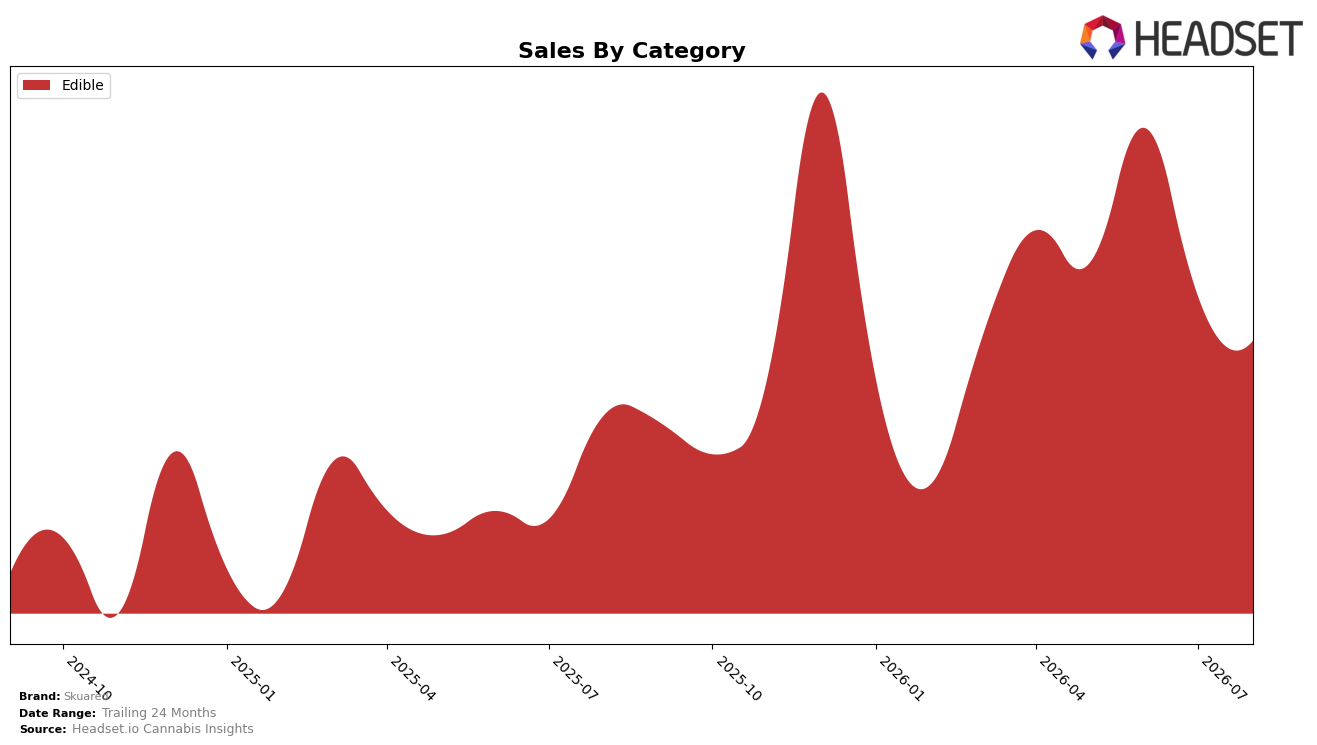
In August 2026, Skuared operated as a single-category brand with Edible accounting for 100.0% of sales, posting year-over-year growth of 8.3% alongside a month-over-month decline of 4.4%. Average price fell 9.5% year over year while sales still rose 8.3%, indicating unit volume expansion offsetting the price compression. With Edible concentration at 100.0% and a Washington Edible rank of 38, the mix suggests reliance on one demand stream that lifted annual sales but softened month-on-month, implying sensitivity to intra-category price moves and seasonal pullbacks.
The combination of a 9.5% price decrease and an 8.3% sales increase indicates a trading-down or pack-size optimization effect within Edibles, while the 4.4% month-over-month dip signals limited short-term pricing power at rank 38. Given that Washington Edible share is effectively 100.0% of Skuared’s portfolio and the year-over-year lift of 8.3% coincides with price compression, positioning tilts toward value-driven Edible formats rather than premium tiers; this implies future gains hinge on sustaining unit velocity as prices normalize and on improving rank from 38 to reduce exposure to month-level volatility.
Competitive Landscape
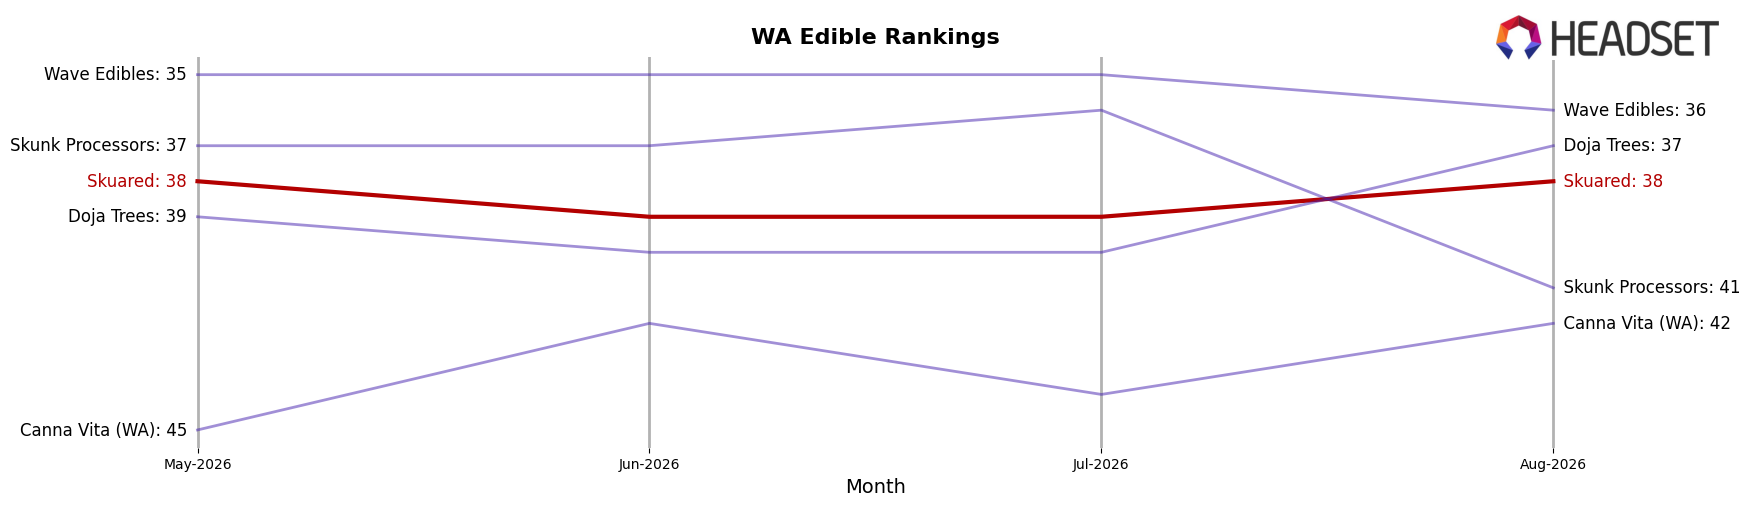
Skuared sits at rank #38 in WA Edible in August 2026, improving 2 positions from #40 year over year, while holding flat versus three months ago at #38; that modest gain still trails the category leaders, as Wyld held #1 year over year with a 5.1% sales increase and Green Revolution stayed at #2 despite a 7.0% decline, indicating that Skuared’s narrow rank advance has not yet translated into share capture against top-tier incumbents. Skuared’s current #38 also remains two spots below its peak #36 from August 2024, and with Craft Elixirs anchored at #5 year over year despite a 13.9% sales decline while Hot Sugar maintained #3 alongside a 6.3% drop, the stability at the top contrasts with mid-pack stagnation, implying Skuared’s trajectory is one of incremental recovery that will require outpacing declining but entrenched competitors to break back into the mid-30s.
Notable Products
CBD/THC 5:1 Caramel Cheesecake Chocolate Squares 10-Pack (500mg CBD, 100mg THC) posted the standout move in August 2026 with a +66% month-over-month gain and climbed into rank 6, while the category leader CBD/THC 5:1 Dark Mint Chocolate Squares 10-Pack (500mg CBD, 100mg THC) fell -24% and still held rank 1. CBD/THC 5:1 Raspberry Cheesecake Chocolate Squares 10-Pack (500mg CBD, 100mg THC) rose +45% at rank 2, contrasting with CBD/THC 5:1 Rocky Road Chocolate Squares 10-Pack (500mg CBD, 100mg THC) slipping -10% at rank 4, and overall nine of the top ten are Edible SKUs from the same 5:1 chocolate family. The mix shows flavor-driven rotation toward dessert profiles as growth concentrates in caramel and cheesecake variants despite a -37% drop for Coconut Delight and a -29% slide for Caramel Apple, implying Skuared’s near-term commercial direction favors fewer, faster-moving sweet flavors over breadth.
Top Selling Cannabis Brands






Data for this report comes from real-time sales reporting by participating cannabis retailers via their point-of-sale systems, which are linked up with Headset’s business intelligence software. Headset’s data is very reliable, as it comes digitally direct from our partner retailers. However, the potential does exist for misreporting in the instance of duplicates, incorrectly classified products, inaccurate entry of products into point-of-sale systems, or even simple human error at the point of purchase. Thus, there is a slight margin of error to consider. Brands listed on this page are ranked in the top twenty within the market and product category by total retail sales volume.

