.svg)
Aug-2026
Sales
Trend
6-Month
Product Count
SKUs
Avg Price
YoY Sales Change
YoY Price Change


Where to Buy
Skunk Processors is stocked at 45 licensed dispensaries across Washington, with the deepest coverage in Seattle, Olympia, Vancouver, Mount Vernon, and Spokane. Search by ZIP code or city below to find the closest one, or filter by product type if you are after a specific format.
Market Insights Snapshot
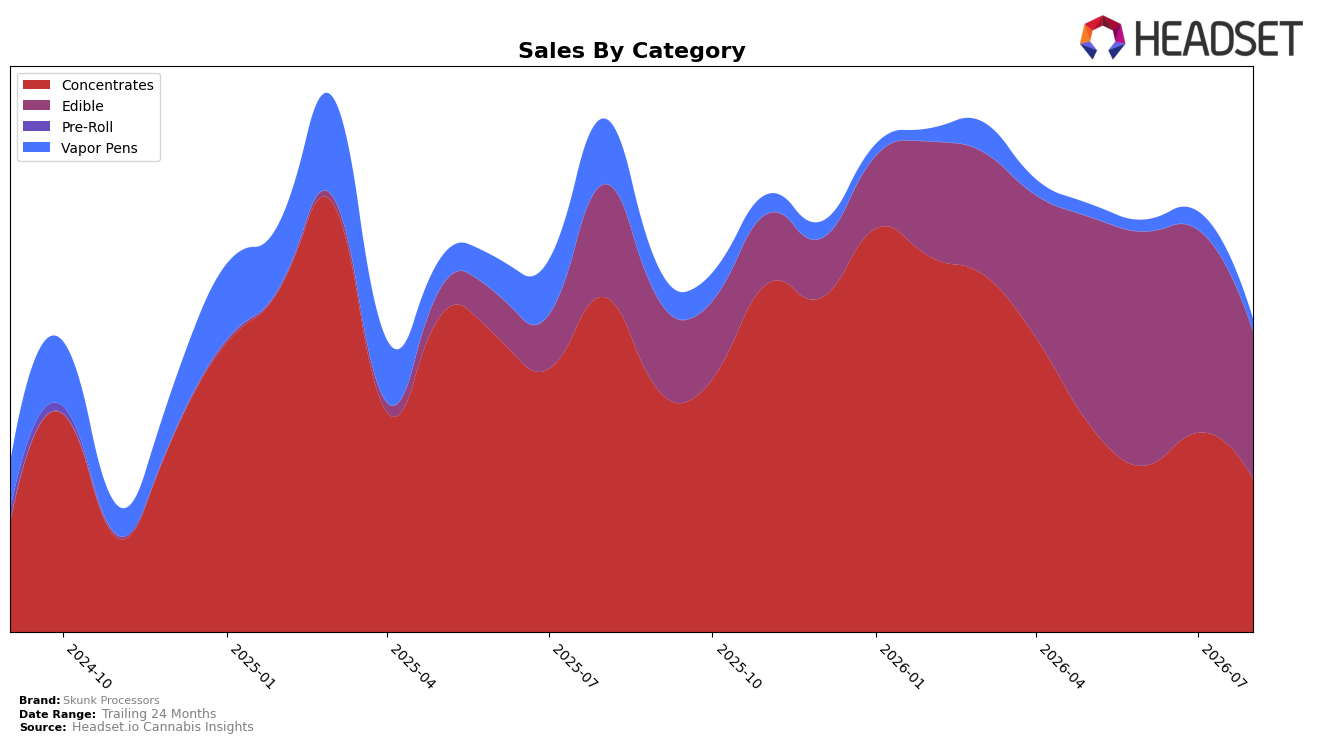
In August 2026, Skunk Processors is split between Concentrates at 48.95% share and Edible at 47.18%, with Vapor Pens a distant 3.87%, indicating a dual-core mix rather than a single-category anchor. Year over year, Concentrates fell 54.38% while Edible grew 31.20%, and month over month both contracted, down 23.29% and 27.29% respectively, with Vapor Pens down 32.51% MoM and 81.49% YoY. Average price fell 21.45% YoY to $10.43 alongside a brand-level sales decline of 39.09% YoY, while the 24-month sales change sits at 59.25%, implying that August 2026 marks a reset from pandemic-era peaks toward a tighter, price-sensitive base where Edible carries incremental demand but not enough to offset Concentrates and Vapor Pens compression.
Edible rising 31.20% YoY while Concentrates contracted 54.38% shifts Skunk Processors toward a more mainstream, lower-ticket basket, consistent with the 21.45% YoY drop in average price and a category rank of 41 in Edible in Washington. The near-parity mix (48.95% Concentrates vs. 47.18% Edible) paired with steeper MoM declines in Edible (27.29%) than in Concentrates (23.29%) suggests the Edible tailwind is seasonal or promo-driven rather than structural, while Vapor Pens at 3.87% share and 81.49% YoY decline caps cross-category trading. The pattern implies the brand’s near-term positioning is migrating from potency-led to value-led formats, with reliance on Edible for incremental volume but vulnerability to demand shocks when deal depth or seasonal lift recedes.
Competitive Landscape
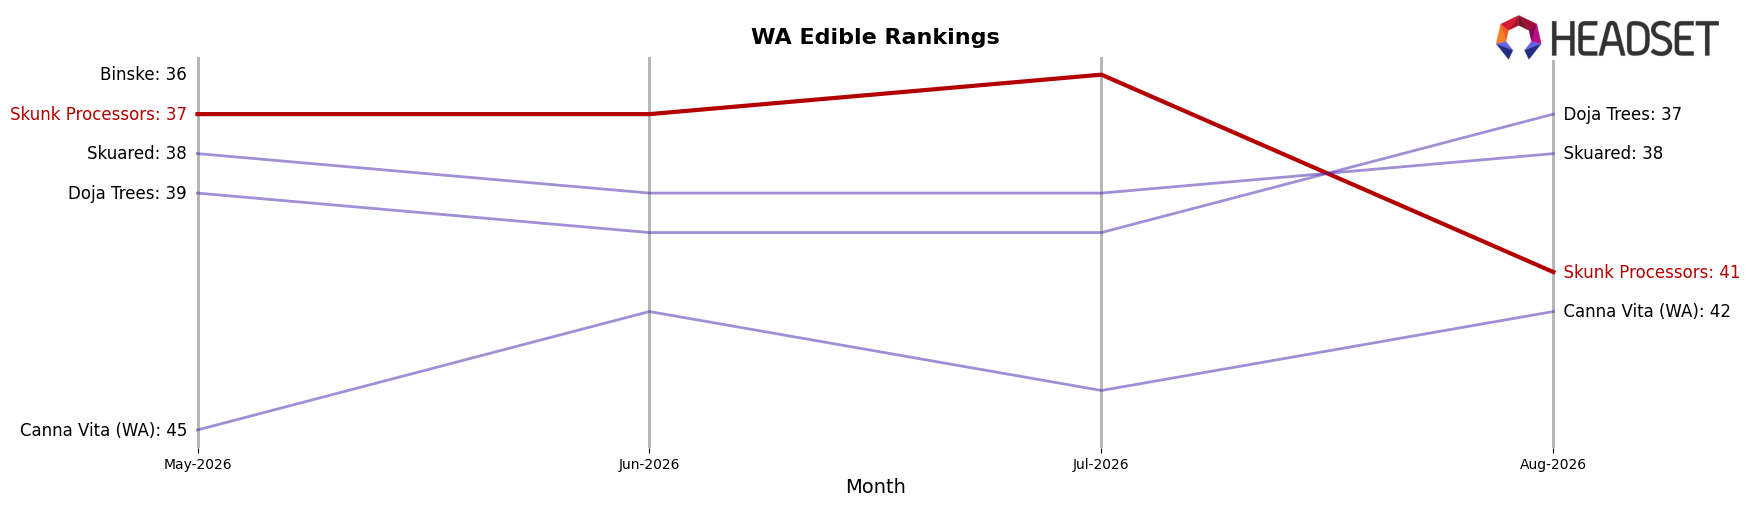
Skunk Processors sits at rank #41 in WA Edible for August 2026, improving 4 positions year over year from #45 while slipping 4 ranks from May 2026’s #37 to August 2026’s #41; the brand also fell 5 positions from its peak #36 in July 2026 to #41 in August 2026. Against market leaders, Wyld held #1 year over year and in August 2026 with a 5.1% YoY sales increase, whereas Craft Elixirs remained at #5 while posting a -13.9% YoY sales change, indicating Skunk Processors’ relative rank gain versus last year (+4 spots) is occurring alongside stability at the top and pressure among top-five incumbents. The pattern implies Skunk Processors’ upward YoY trajectory is incremental rather than accelerating, with recent month-over-month rank erosion suggesting it needs near-term share capture to avoid slipping back into the mid-40s.
Notable Products
Watermelon Hash Rosin Gummies 10-Pack (100mg) posted the steepest decline in August 2026 at -36.21% and slipped to rank 5, while Ice Cream Cake Rosin Batter (1g) fell -37.78% to rank 8. Sub Zero Solventless Batter (1g) also contracted -10.75% at rank 8, contrasting with Nano Chillz - CBD/THC 1:1 Pink Lemonade Frozen Pops 10-Pack (100mg CBD, 100mg THC) which inched up +3.84% at rank 3. Four of the top ten are Concentrates and four are Edible SKUs, but the Edible set contains the three largest percentage drops, indicating the frozen pop and gummy push is overexposed to cooling seasonal demand.
Top Selling Cannabis Brands






Data for this report comes from real-time sales reporting by participating cannabis retailers via their point-of-sale systems, which are linked up with Headset’s business intelligence software. Headset’s data is very reliable, as it comes digitally direct from our partner retailers. However, the potential does exist for misreporting in the instance of duplicates, incorrectly classified products, inaccurate entry of products into point-of-sale systems, or even simple human error at the point of purchase. Thus, there is a slight margin of error to consider. Brands listed on this page are ranked in the top twenty within the market and product category by total retail sales volume.

