.svg)


Where to Buy
Sun House is stocked at 31 licensed dispensaries across Colorado, with the deepest coverage in Denver, Colorado Springs, Aurora, Longmont, and Basalt. Search by ZIP code or city below to find the closest one.
Market Insights Snapshot
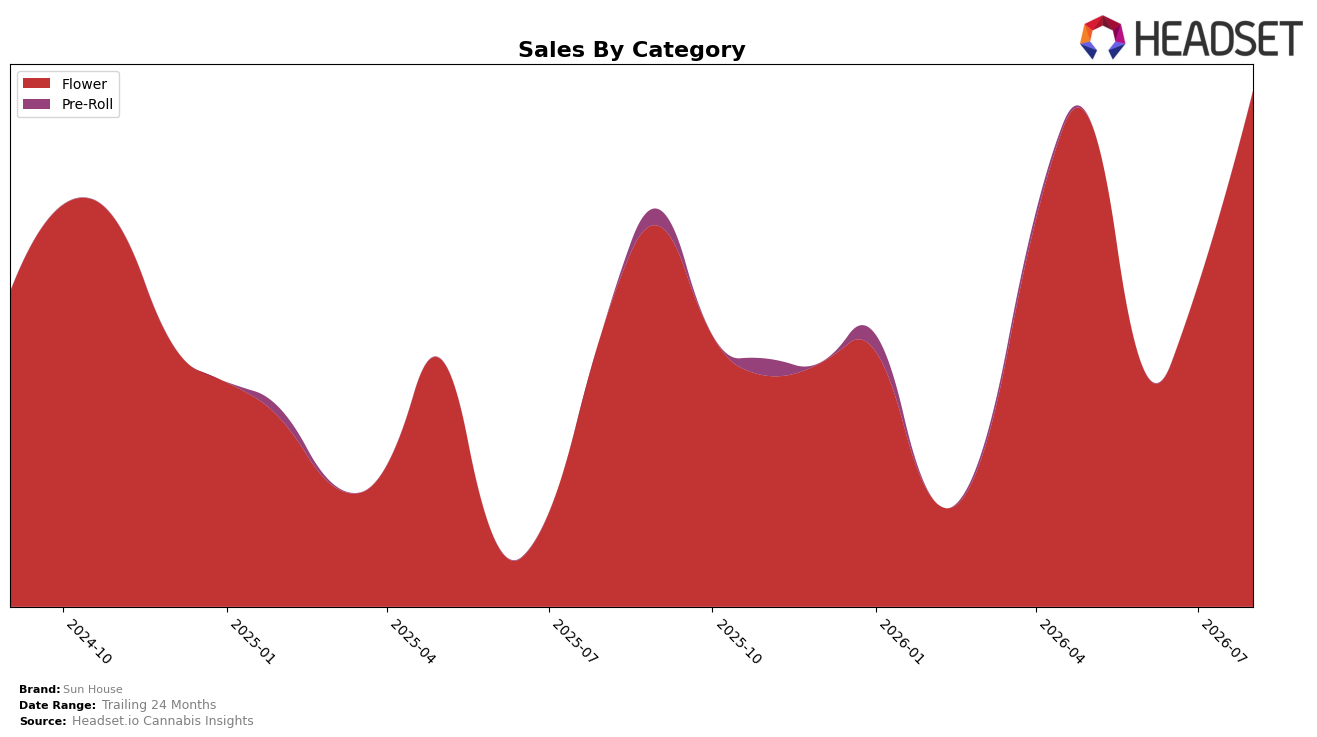
In August 2026, Sun House concentrated entirely in Flower with a 100.0% category share, pairing an 83.24% year-over-year sales lift with a 60.77% month-over-month gain and a 159.44% YoY increase in average price; the single-category focus coincided with a state-category rank of 33 in Flower in Colorado. The pattern implies that pricing power and velocity are both expanding within Flower rather than being diversified across categories, with the 60.77% MoM surge and 83.24% YoY rise pointing to accelerating demand capture at current price points while the rank of 33 anchors near-term headroom within the state-category ladder.
The consolidation in Flower suggests Sun House is trading depth for breadth: a 100.0% mix and 159.44% YoY price increase indicate an up-tiered positioning inside Flower rather than cross-category expansion, while the 60.77% MoM and 83.24% YoY sales gains imply elasticity remains favorable at today’s price. Given the rank of 33 in Colorado Flower and the 83.24% YoY growth rate, the brand’s near-term path likely hinges on sustaining price while improving unit throughput, with the single-category focus reinforcing identity but capping diversification benefits if momentum in Flower moderates.
Competitive Landscape
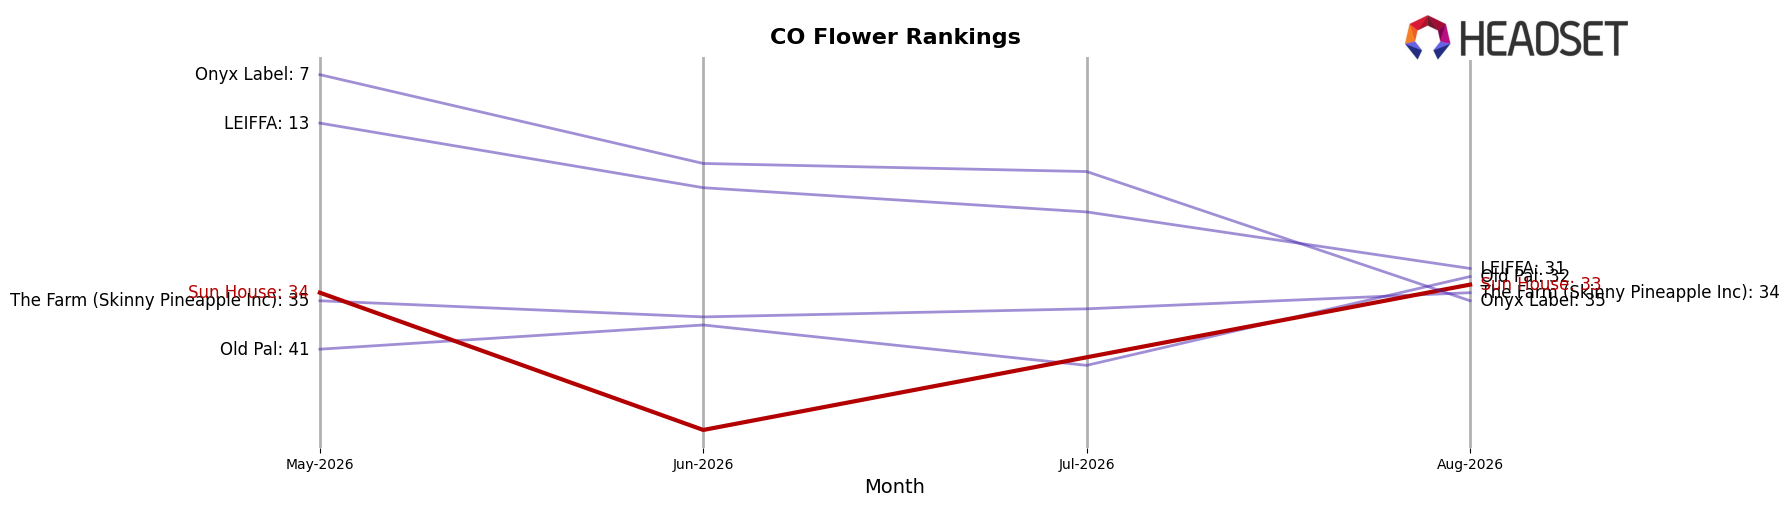
Sun House holds rank #33 in Colorado Flower in August 2026, improving 24 positions year over year from #57 and edging 1 place versus May 2026’s #34; this is also a peak rank at #33, while the top tier is stable with Seed & Strain Cannabis Co. rising from #2 to #1 and posting a 44.85% YoY sales gain as Green Label Cannabis slipped from #1 to #2 with just 1.27% YoY growth. Further up the podium, Green Dot Labs advanced from #5 to #3 on 36.47% YoY growth while Good Chemistry Nurseries moved from #3 down to #4 with a -3.60% YoY decline, indicating a ladder where gains are concentrated at the very top even as Sun House’s 24-rank YoY climb and 1-rank three-month lift signal mid-pack momentum that could translate into share capture if the upward cadence persists.
Notable Products
Blue Limonene (Bulk) delivered the standout move in August 2026 with a +860% month-over-month surge and entered the leaderboard at rank 6, while Blue Zushie (Bulk) also accelerated at +227% to rank 8. In contrast, Strawbanger Shake (Bulk) fell 31% yet held rank 1, and Blue Zushi Popcorn (Bulk) declined 14% to rank 3. Four of the top ten are Flower Shake or Popcorn variants, and within that subset Jimmy Puffet Popcorn (Bulk) advanced 77% to rank 5 while Block Berry Shake (Bulk) dropped 80% to rank 9, indicating volatility concentrated in value-oriented cuts. The pattern implies Sun House is tilting toward aggressive trial and trade-up on bulk Flower, with rapid gains from newly scaled SKUs offsetting pressure on legacy Shake volume and signaling a shift toward breadth over reliance on a single leader.
Top Selling Cannabis Brands






Data for this report comes from real-time sales reporting by participating cannabis retailers via their point-of-sale systems, which are linked up with Headset’s business intelligence software. Headset’s data is very reliable, as it comes digitally direct from our partner retailers. However, the potential does exist for misreporting in the instance of duplicates, incorrectly classified products, inaccurate entry of products into point-of-sale systems, or even simple human error at the point of purchase. Thus, there is a slight margin of error to consider. Brands listed on this page are ranked in the top twenty within the market and product category by total retail sales volume.

