.svg)
Aug-2026
Sales
Trend
6-Month
Product Count
SKUs
Avg Price
YoY Sales Change
YoY Price Change


Where to Buy
Terpnado is stocked at 82 licensed dispensaries across Washington, with the deepest coverage in Tacoma, Spokane, Seattle, Everett, and Lacey. Search by ZIP code or city below to find the closest one, or filter by product type if you are after a specific format.
Market Insights Snapshot
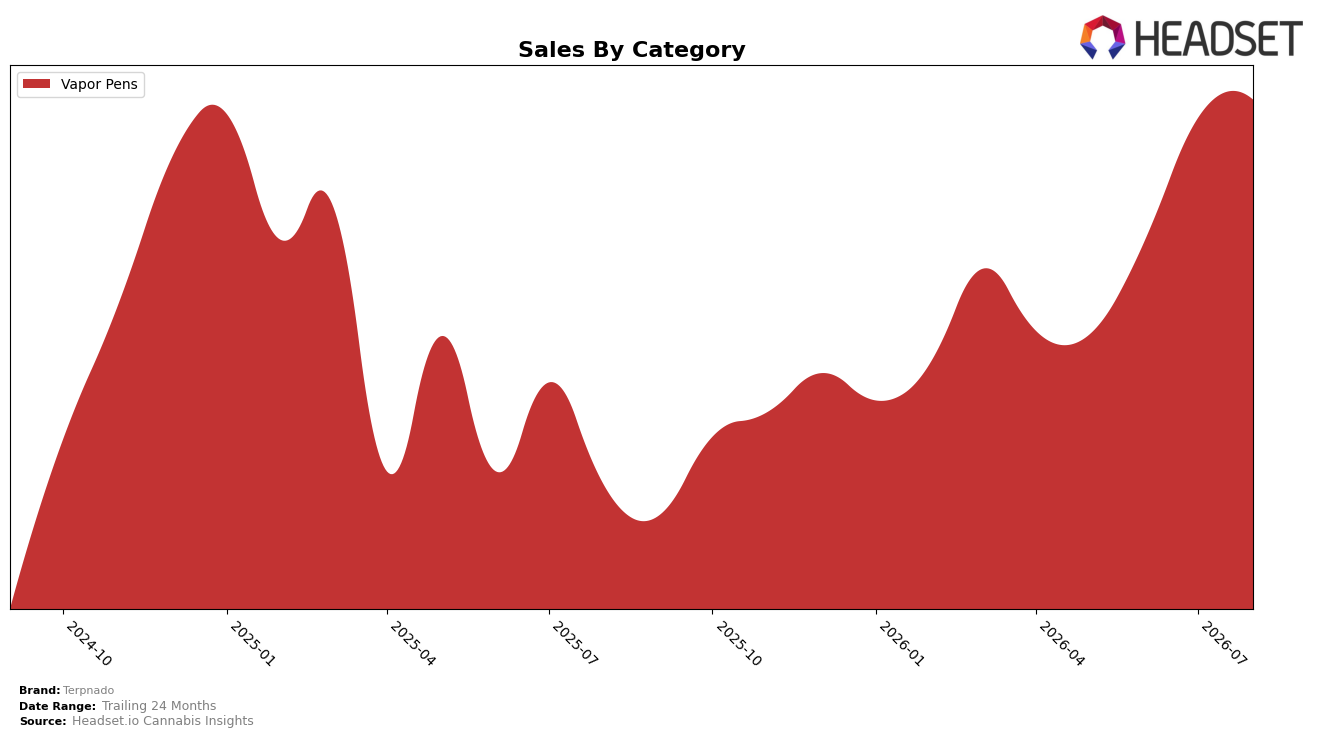
In August 2026, Terpnado’s category mix was fully concentrated in Vapor Pens at 100.0% share, with category sales up 57.6% year over year and 1.8% month over month, while average price declined 6.6% year over year. Within Washington Vapor Pens, the brand held rank 33, pairing a rank in the low-30s with an expanding volume base, which together indicate the brand is leaning on unit growth rather than price to drive gains. The pattern implies Terpnado is consolidating around a single-category play where incremental month-over-month volume (+1.8%) and double‑digit year-over-year growth (+57.6%) are outpacing its price contraction (‑6.6%), positioning the brand to trade share via value within the Vapor Pens set.
The sustained 100.0% category focus, alongside a 57.6% year-over-year sales lift and a 1.8% month-over-month uptick, coupled with a 6.6% year-over-year average price decline, points to a value-led positioning that could improve unit throughput without immediate mix diversification. Holding rank 33 in Washington while prices fall suggests the brand is prioritizing velocity gains over premium price signaling, and the August 2026 month-over-month expansion supports a push to capture price-sensitive shoppers. The implication is that Terpnado’s near-term leverage comes from defending and expanding within Vapor Pens through value density, with the risk that maintaining rank in the 30s while cutting price may cap premium perception unless future months translate the 57.6% year-over-year growth into upward rank movement.
Competitive Landscape
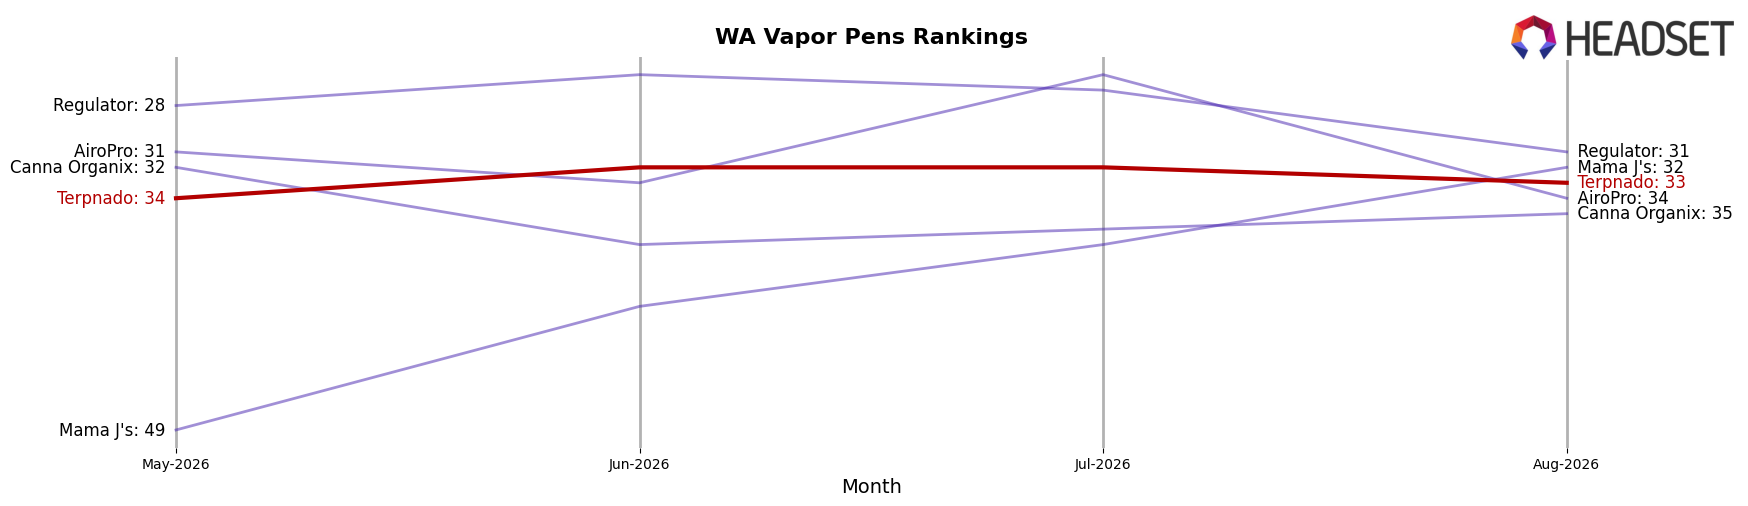
Terpnado is ranked #33 in Washington Vapor Pens in August 2026, improving 8 positions from #41 year over year, while slipping 1 position from #34 since May 2026; against this, Crystal Clear climbed from #3 to #1 with a 19.4% sales increase and Mfused fell from #1 to #2 with a 32.6% sales decline, indicating the top tier is fluid even as Terpnado remains mid-pack. Terpnado’s current #33 sits 7 places below its peak #26 from January 2025 and 30 places behind the current leader, and with Plaid Jacket advancing from #6 to #3 alongside 15.5% YoY growth while Phat Panda dropped from #2 to #5 with a 20.0% YoY decline, the pattern implies Terpnado’s gradual rank recovery is occurring amid divergent competitor momentum and will require outpacing both gaining and contracting rivals to re-enter the top 25.
Notable Products
Golden Peach Distillate Cartridge (1g) posted the steepest decline in August 2026 at -12.25% and slid to rank 8, while Alien Sour Apple Distillate Disposable (1g) fell -8.74% at rank 7, signaling demand is tilting away from certain fruit profiles within Vapor Pens. Watermelon Crawl Distillate Disposable (1g) held rank 1 with +8.11% MoM and Strawberry Turbo Distillate Cartridge (1g) climbed +12.58% at rank 2, whereas Alien Sour Apple Distillate Cartridge (1g) dipped -1.71% despite sitting at rank 3, indicating momentum is consolidating at the top around two SKUs with rising velocity. Four of the top ten are Watermelon or Strawberry family variants across cartridges and disposables, and Blueberry Express Distillate Cartridge (1g) advanced +20.94% to rank 4 while Watermelon Crawl Distillate Cartridge (1g) rose +20.40% at rank 3 with $11,735 in sales, implying Terpnado’s mix is concentrating on a narrow set of sweet-fruit profiles that can be extended across formats for share retention.
Top Selling Cannabis Brands






Data for this report comes from real-time sales reporting by participating cannabis retailers via their point-of-sale systems, which are linked up with Headset’s business intelligence software. Headset’s data is very reliable, as it comes digitally direct from our partner retailers. However, the potential does exist for misreporting in the instance of duplicates, incorrectly classified products, inaccurate entry of products into point-of-sale systems, or even simple human error at the point of purchase. Thus, there is a slight margin of error to consider. Brands listed on this page are ranked in the top twenty within the market and product category by total retail sales volume.

