.svg)


Where to Buy
Walli-Pop is stocked at 20 licensed dispensaries across Ohio, with the deepest coverage in Columbus, Cincinnati, Warren, Akron, and Athens. Search by ZIP code or city below to find the closest one.
Market Insights Snapshot
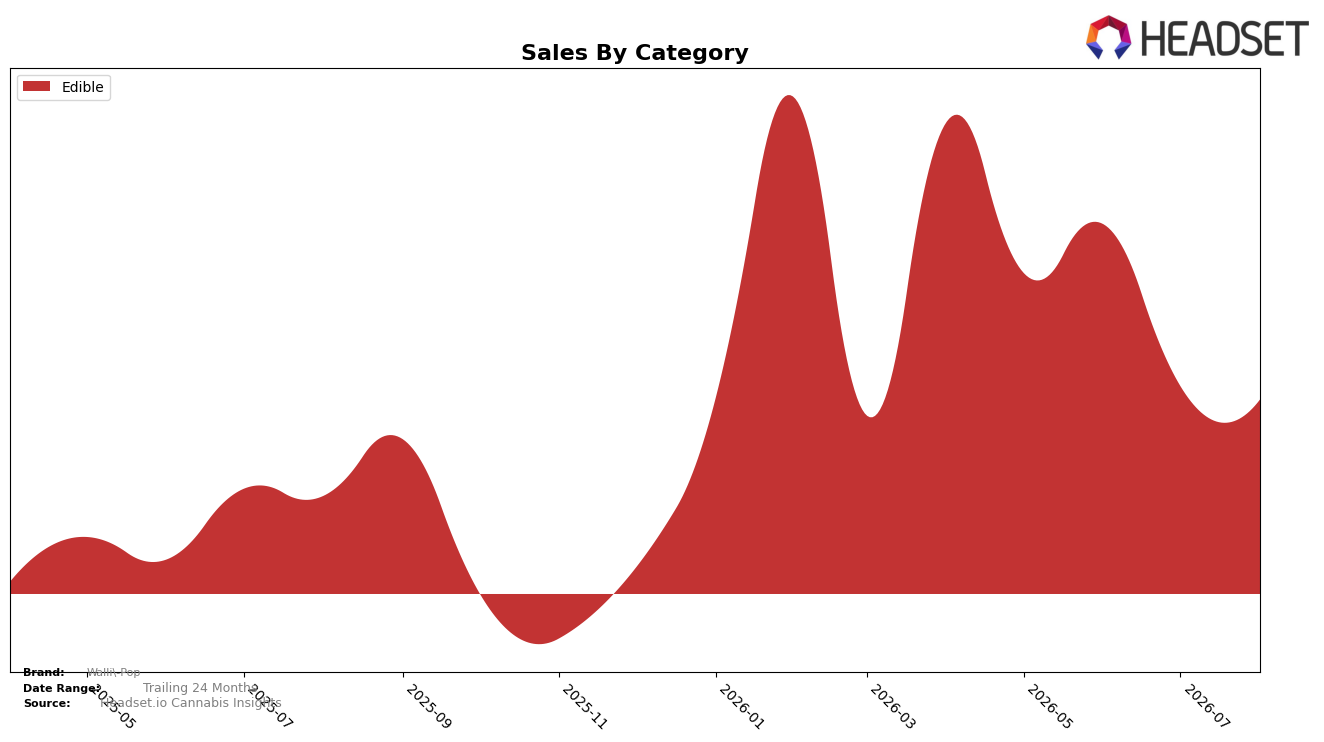
Edible accounted for 100.0% of Walli-Pop sales in August 2026, with year-over-year growth of 95.38% but a month-over-month decline of 6.34%. Average price rose 76.66% year over year to $27.72 while the overall brand rank in Edible sat at position 45 in Ohio. The pattern implies a single-category dependency where rapid annual velocity is counterbalanced by recent monthly deceleration, concentrating risk and opportunity entirely within Edible.
With Edible as the sole revenue driver at 100.0% share and rank 45 in Ohio, the 76.66% YoY price increase alongside 95.38% YoY sales growth suggests pricing power without immediate rank lift, while the 6.34% MoM sales dip indicates price elasticity or seasonal softening. The implication is that Walli-Pop’s positioning relies on sustaining premium pricing in Edible while improving throughput to climb from rank 45, as current momentum is uneven across time frames.
Competitive Landscape
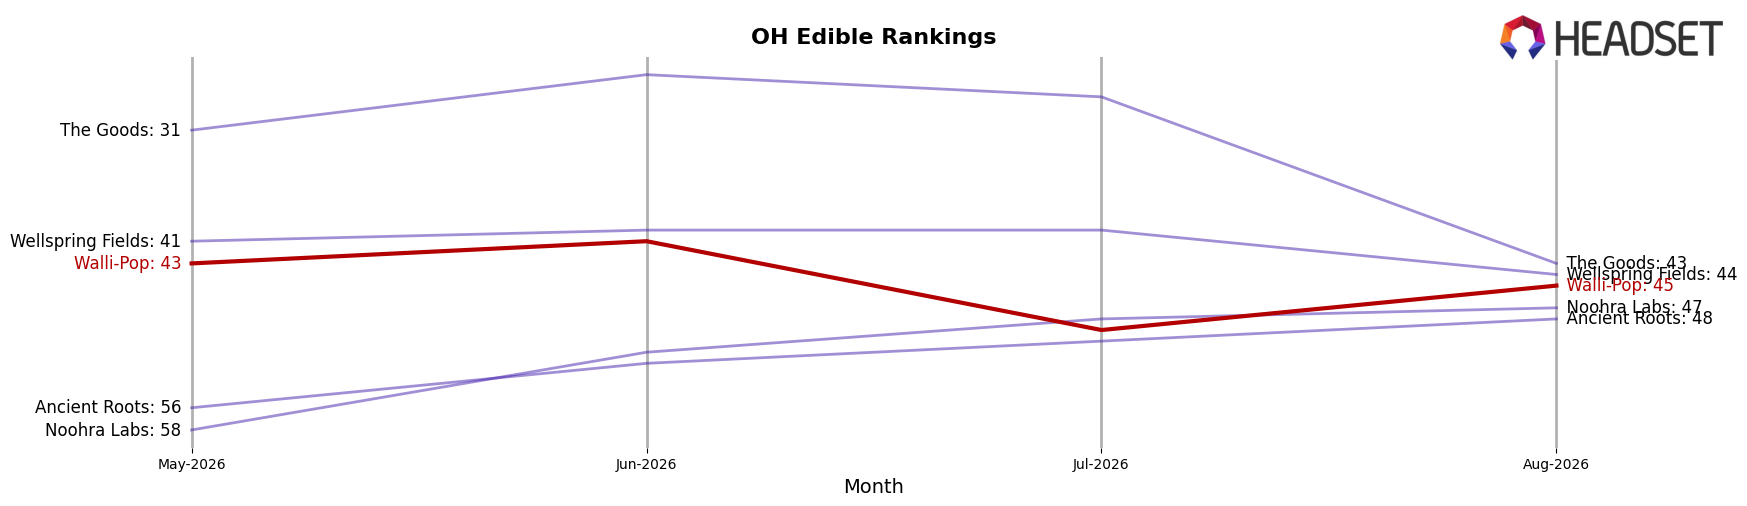
Walli-Pop is currently ranked #45 in OH Edible, improving 12 positions from #57 year over year, but slipping 2 spots from #43 in May 2026 to #45 in August 2026; relative to its April 2026 peak at #35, the brand is 10 ranks lower, while market leaders shifted meaningfully as Gron / Grön climbed from #8 to #1 with 91.3% YoY sales growth and Incredibles edged from #1 to #2 with 3.4% YoY growth. Against the top five, Walli-Pop’s 3-month slippage of 2 ranks contrasts with UB GOOD rising from #2 to #3 alongside 10.9% YoY growth and Smokiez Edibles declining from #4 to #5 with a 6.1% YoY sales contraction, indicating that Walli-Pop’s incremental YoY rank gain is not yet translating into sustained momentum amid faster-moving leaders. The thesis is that Walli-Pop’s upward YoY rank change alongside recent intra-quarter softening suggests a mid-pack ceiling forming unless the brand narrows the 10-rank gap back to its April 2026 peak and counters the acceleration at the top.
Notable Products
Cherry Cola Gummies 10-Pack (100mg) posted an -84.95% month-over-month slide to rank 3 in August 2026, while Strawberry Gummies 10-Pack (400mg) jumped +72.83% to take rank 1. Pineapple Gummies 10-Pack (200mg) in rank 2 rose +8.15%, and Dreamsicle Gummies 10-Pack (100mg) fell -22.87% at rank 5. Five of the top five are Edible SKUs, and the concentration alongside a single outsized decline signals a portfolio pivot toward higher-dosage winners and flavor rationalization around a few leaders.
Top Selling Cannabis Brands






Data for this report comes from real-time sales reporting by participating cannabis retailers via their point-of-sale systems, which are linked up with Headset’s business intelligence software. Headset’s data is very reliable, as it comes digitally direct from our partner retailers. However, the potential does exist for misreporting in the instance of duplicates, incorrectly classified products, inaccurate entry of products into point-of-sale systems, or even simple human error at the point of purchase. Thus, there is a slight margin of error to consider. Brands listed on this page are ranked in the top twenty within the market and product category by total retail sales volume.

